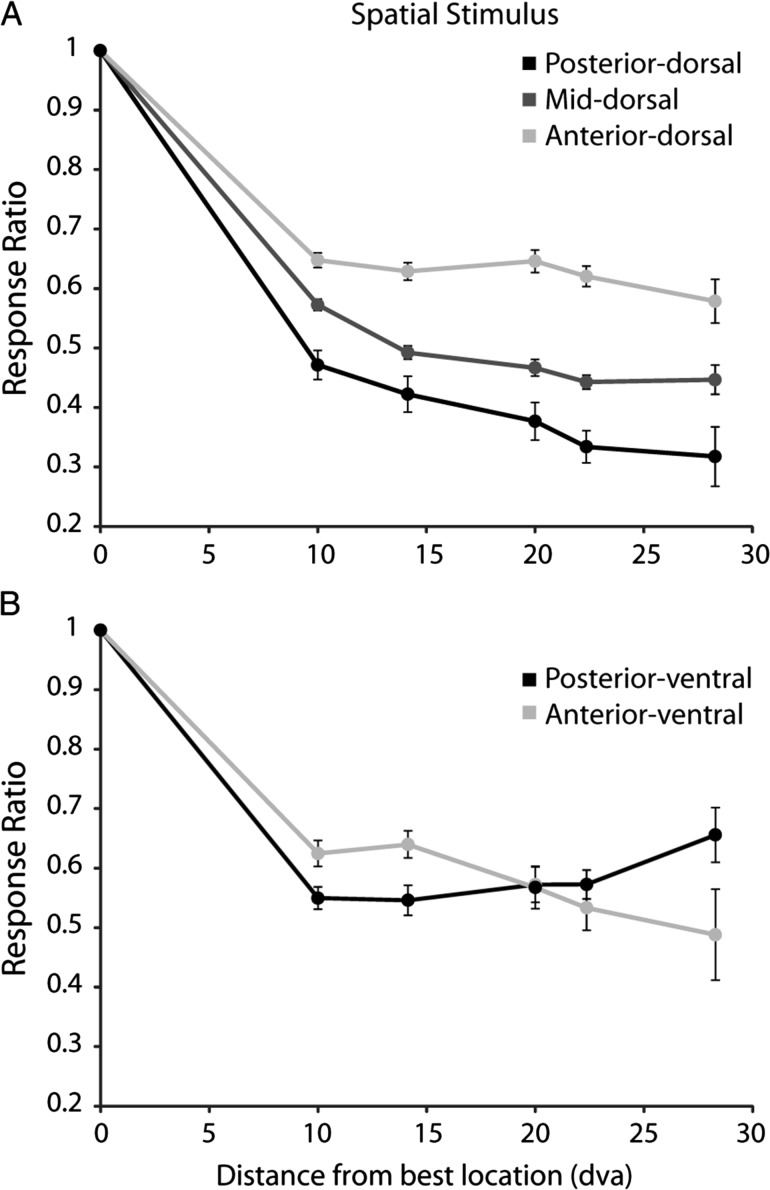
Figure 6.
Mean ratio of discharge rate for a stimulus at varying distances from the location that elicited the best response. (A) Dorsal regions. N = 65 neurons in posterior-dorsal, N = 253 in mid-dorsal, N = 104 in anterior-dorsal region. (B) Ventral regions; N = 66 in posterior-ventral and N = 33 in anterior-ventral. The ratio was calculated separately for each neuron, and averaged across neurons. Error bars represent the standard error of the mean calculated across neurons.

