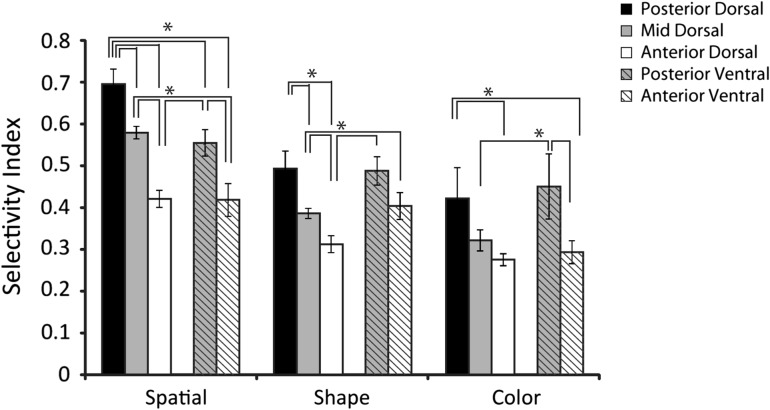
Figure 7.
Average selectivity index for each of the stimulus sets, among neurons with significant responses to stimuli (N = 67 posterior-dorsal, N = 264 mid-dorsal, N = 123 anterior-dorsal, N = 70 posterior-ventral, and N = 52 anterior-ventral). Error bars represent standard error of the mean computed across all neurons. All line diagrams plotted represent significant differences between the corresponding bars, evaluated with a 1-way ANOVA and Tukey post-hoc test (P < 0.05).

