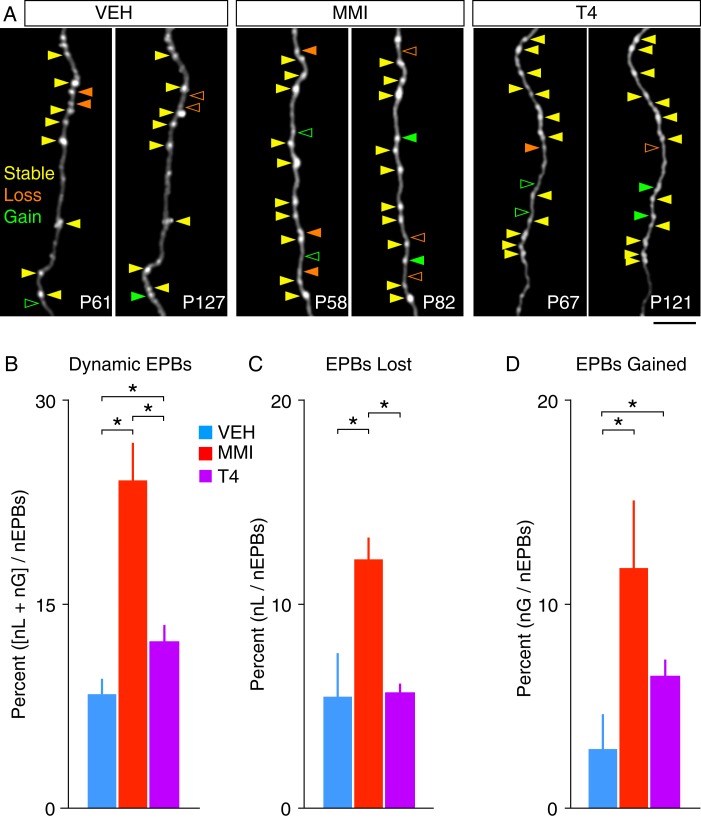
Figure 4.
Summary of EPB turnover in TC axons. (A) Example two-photon images showing example EPB changes between imaging days from each group (solid arrowhead = EPB present, open arrowhead = EPB absent). (B) Summary of overall EPB dynamics (means ± SEM, *P < 0.05). (C) Summary of EPB losses (means ± SEM, *P < 0.05). (D) Summary of EPB gains (nL, number lost; nG, number gained; nEPBs, total number of EPBs; means ± SEM, *P < 0.05). (Scale bar = 25 μm).

