Fig. 1.
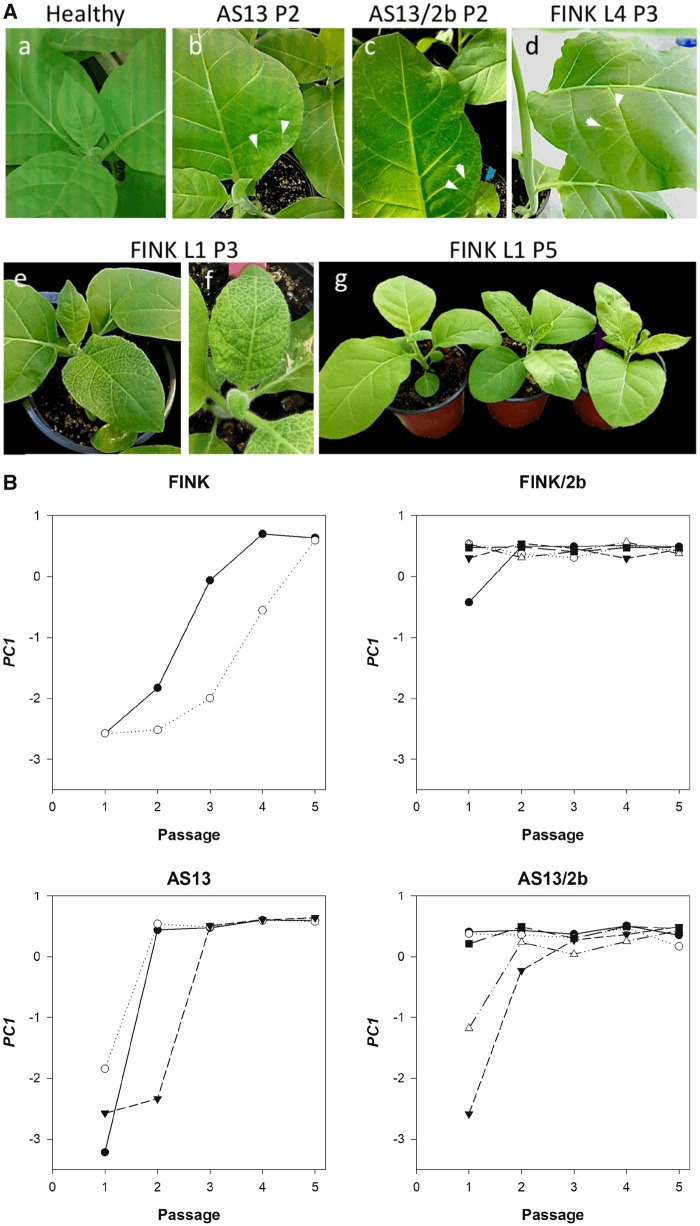
—(A) Symptoms induced by the ancestral and evolved TEV genotypes. Upper panel: from left to right, (a) healthy plant, (b) chlorotic spots observed in a plant of passage 2 (P2) infected with one of the TEV-AS13 lineage, (c) the same for a plant infected with a one of the TEV-AS13/2b lineages, and (d) a plant from the third passage (P3) infected with lineage L4 of TEV-FINK. White arrows indicate the location of some chlorotic spots. Lower panel: (e) and (f) plants of passage P3 infected with lineage L1 of TEV-FINK showing the typical etching of TEV, (g) comparison of plants from the fifth passage (P5): healthy (left) or infected with lineage L1 of TEV-FINK (right), thus displaying no symptoms or the typical etch mosaic of TEV, respectively. (B) Evolution of the first principal component (PC1) summarizing the six pathogenicity-related traits. See text for a detailed description of the contribution of the different traits into PC1. Different symbols correspond to the different independently evolved lineages.

