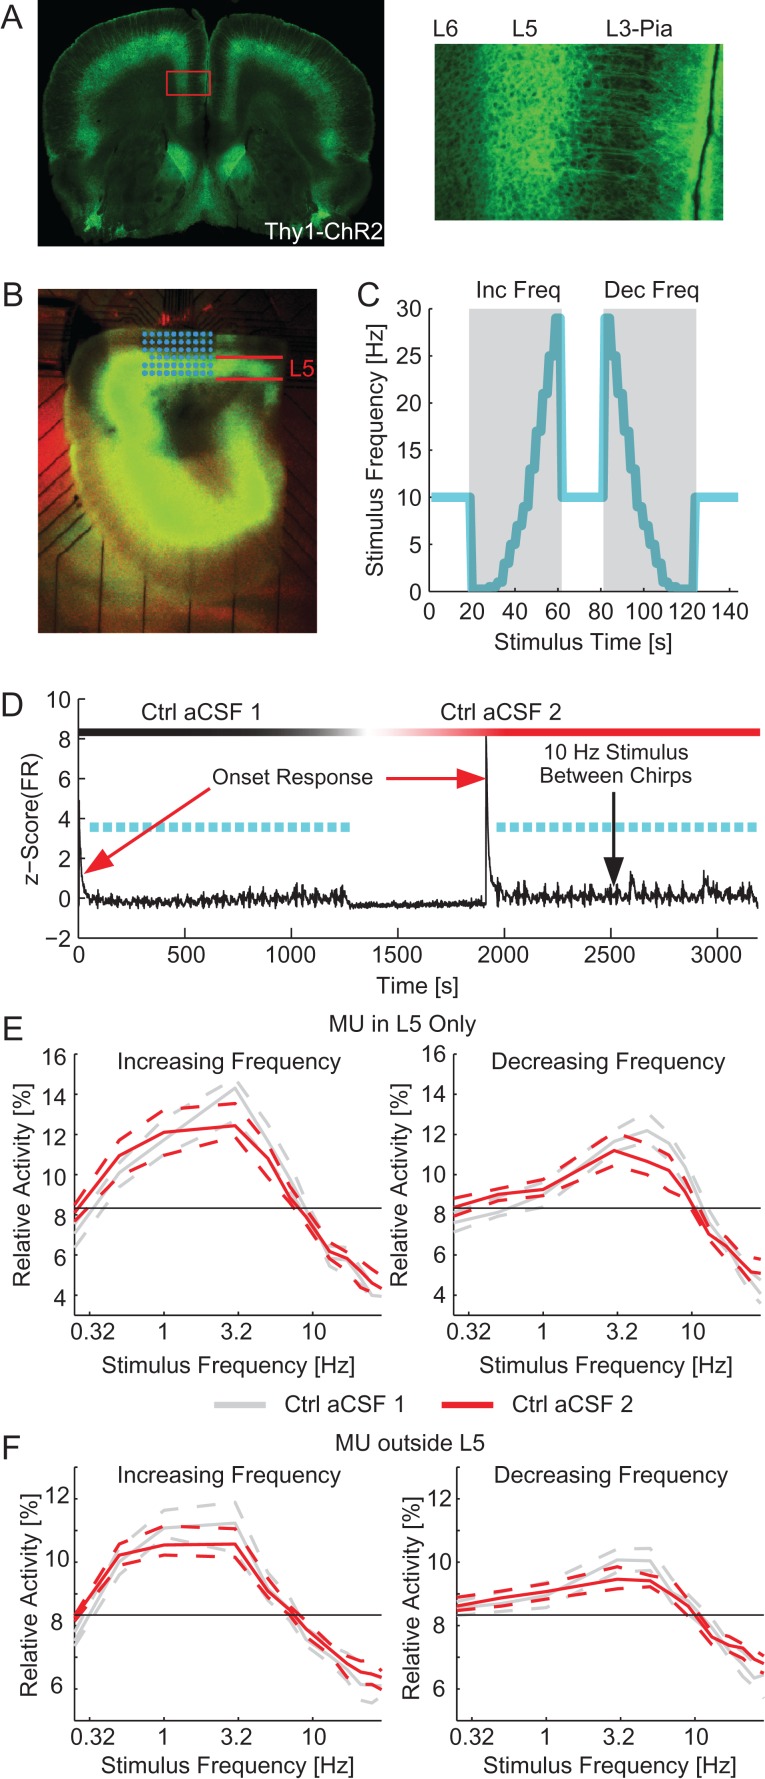
Figure 1.
Network resonance by optogenetic activation of L5 PYs. (A) Fluorescence images of a coronal section containing mPFC. Left: eYFP expression throughout a coronal section, all neocortical regions express eYFP in L5. Right: Zoom-in of mPFC displaying eYFP in cell bodies and dendrites of cells originating in L5. (B) Fluorescence image of an experimental slice on the MEA. L5 indicated in red. MEA electrodes superimposed in cyan. (C) Frequency of optogenetic stimulation (cyan) for 2 sample trials denoted with gray background. A 10 Hz conditioning stimulus is applied for 20 s between trials. Trials consisted of chirp stimuli ranging from 0.25 to 29 Hz applied in either increasing (left) or decreasing (right) order. (D) The mean z-scored firing rate for all MU during an experiment (black). Frequency sweeps are indicated in cyan. After the completion of the first epoch of stimulation (~1300 s), the perfusion was switched to another container of control aCSF. A second epoch of stimulation was applied 10 min after switching the aCSF (~1900 s here). The red arrows illustrate the strong onset response to the start of stimulation epochs. Black arrow indicates the response during the 20 s of 10 Hz stimulus between chirps. (E) The relative activity for each frequency of stimulation for increasing (left) and decreasing (right) frequency chirp stimuli for MU in L5. The response during the first epoch of stimulation is in gray. The response of the second epoch of stimulation is in red. The black line indicates chance level of activity. In both cases, the network exhibited a resonant frequency in the high delta to low theta range. (F) The relative activity for each frequency of stimulation for increasing (left) and decreasing (right) frequency chirp stimuli for MU outside of L5 (including L1, L2/3, and L6). The response during the first epoch of stimulation is in gray. The response of the second epoch of stimulation is in red. In both cases, the network exhibited a resonant frequency in the high delta to low theta range. Inc Freq, increasing frequency chirps; Dec Freq, decreasing frequency chirps; Ctrl aCSF, control aCSF. Dashed lines indicate the 95% confidence interval of the median.

