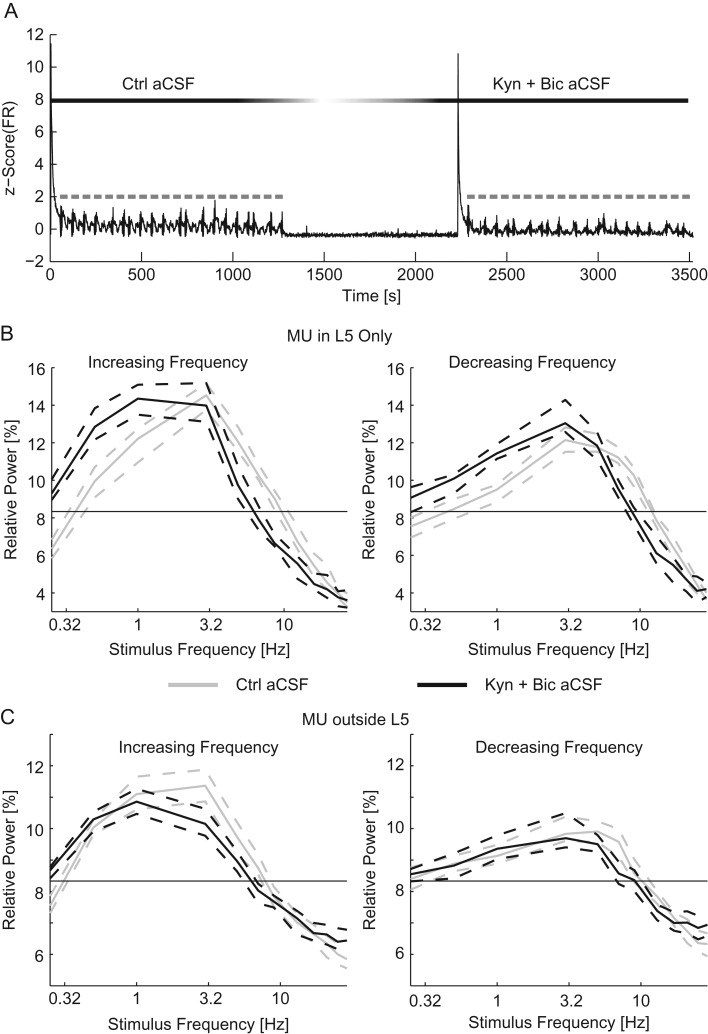
Figure 3.
Suppression of synaptic transmission favors slower stimuli. (A) The z-scored time course of the MU firing rate (black) for the duration of the experiment. Optogenetic chirps are indicated in gray. After the first epoch of stimulation with control aCSF the perfusion was switched to Kyn + Bic aCSF. Ten minutes after the addition of synaptic blockers, a second epoch of stimulation was applied. The relative activity of MU recorded in L5 (B) and MU recorded outside of L5 (C) for increasing (left) and decreasing (right) frequency stimuli. For chirps in control aCSF (gray) and Kyn + Bic aCSF (black). The thin black line indicates chance activity levels. The addition of synaptic blockers caused a shift in the frequency response in favor of slow stimuli. Dashed lines indicate the 95% confidence interval of the median. Ctrl aCSF, control aCSF.

