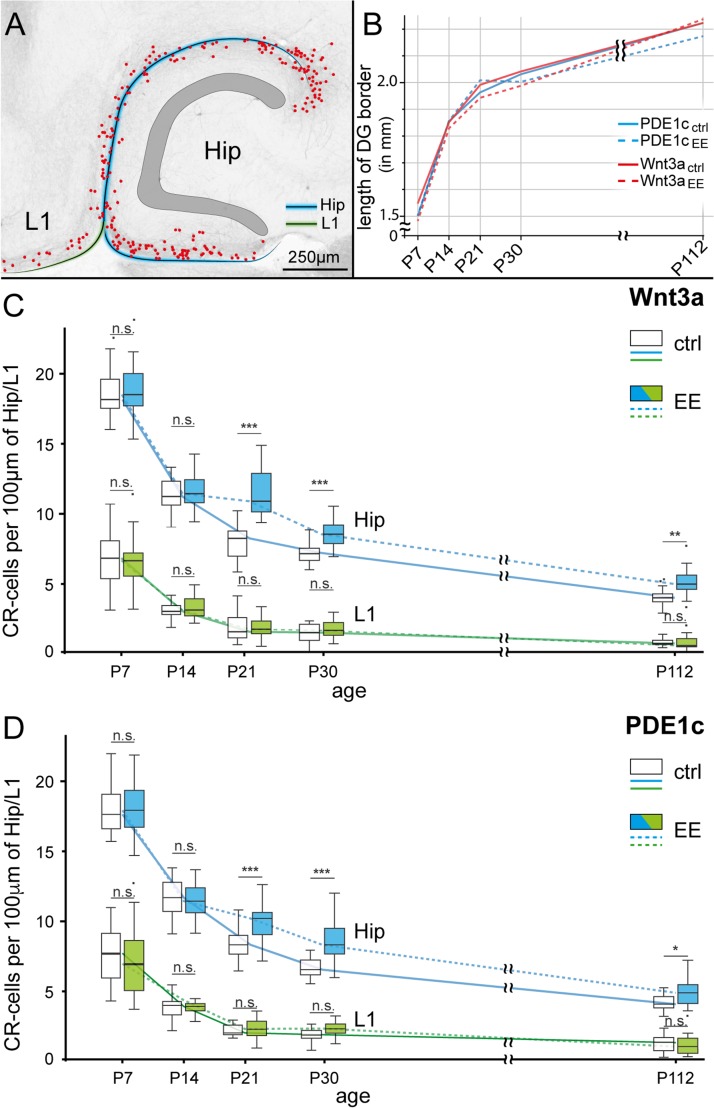
Figure 6.
Region-specific developmental regulation and effect of enriched environment on Cajal–Retzius cells. (A) Sample image showing the 2 regions taken into consideration for the presented analysis: molecular layers of the hippocampus (along the hippocampal fissure and the infrapyramidal blade of the dentate gyrus: blue line) and layer 1 (L1) of the adjacent cortical areas (green line). CR-cell positions are marked by red dots. (B) Summary plot of the growth curve for the different mouse genotypes and experimental conditions (ctrl = control, EE = enriched environment) measured by the border-length of the dentate gyrus (see blue line in [A]). Notice the lack of any significant difference (P > 0.05). (C) Developmental time-course of hippocampal (blue lines) and layer 1 (green lines) Cajal–Retzius cell density under control (ctrl, solid line) and environmental enriched (EE, dotted lines) conditions. Box plots for different conditions at the same age have been shifted side by side to allow comparisons. Please notice the effect of EE on hippocampal, but not layer one Cajal–Retzius cells. Data from Wnt3a mice. (D) Same as in (C), but obtained in sections from PDE1c mice. Notice the similarity of the results in the 2 different reporter strains.

