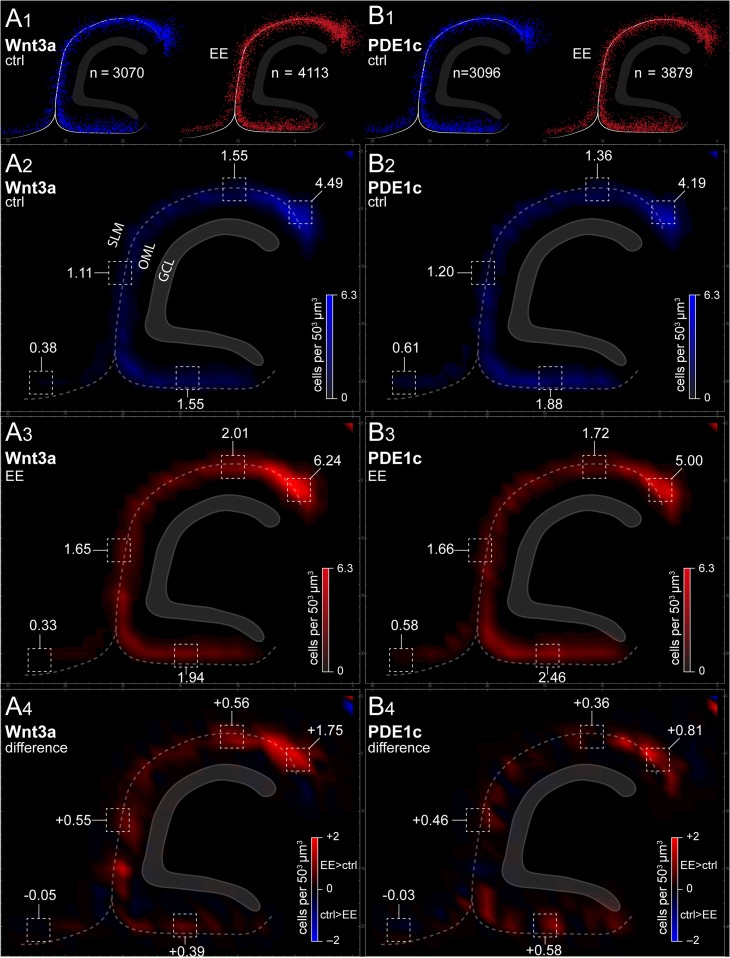
Figure 7.
Summary plots of Cajal–Retzius cell distributions along the hippocampal molecular layers and cortical layer 1. (A1) Raw dot plots indicating the distribution of all Cajal–Retzius cells analyzed (P21 Wnt3a mouse). Left panel: control group (ctrl, blue dots). Right panel: environmental enriched conditions (EE, red dots). Notice the higher numbers of Cajal–Retzius cells in the latter group. (A2,A3) Summary density graphs for animals housed in control (blue scale) and enriched conditions (red scale). (A4) Plot of the overall density difference between the 2 experimental conditions. Notice the increased density distributed broadly along the hippocampal molecular fields, but the lack of change in layer 1 of the adjacent cortex. (B1−B4) As in (A1−A4), but for PDE1c animals.

