Figure 9.
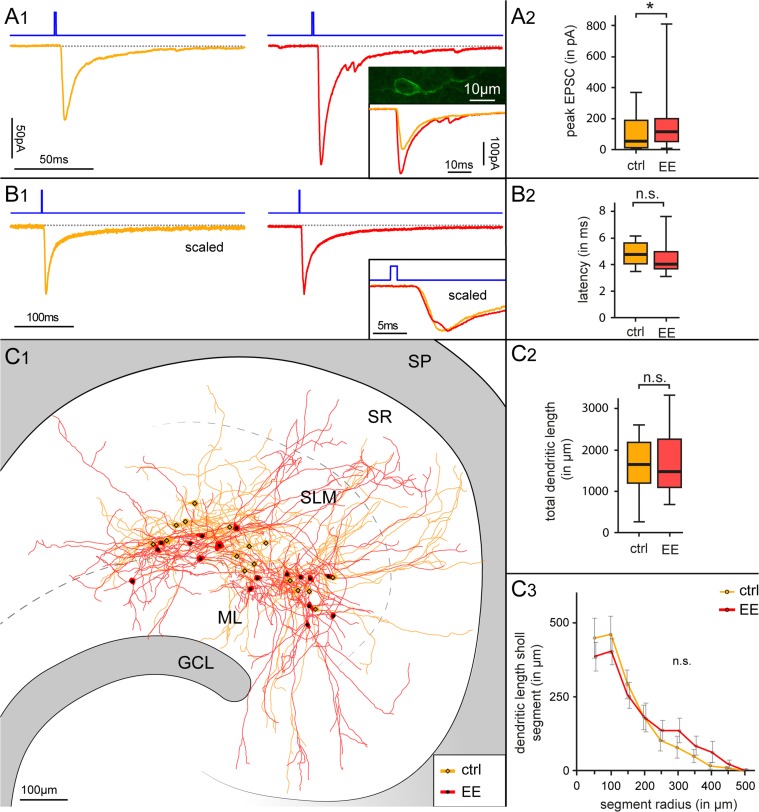
Functional impact of environmental enriched conditions on synaptic currents generated by Cajal–Retzius cells onto interneurons. (A1) Optogenetic stimulation of Cajal–Retzius cells in slices obtained from Wnt3a-ChR mice housed in standard versus enriched conditions. Notice the larger synaptic current evoked in interneurons in the treated (right, red trace) when compared with the control group (left, dark yellow trace). Duration of light flash stimulation (1 ms) is indicated by the blue line above the recordings. The inset shows the eYFP confocal image of a typical Cajal–Retzius cell in the Wnt3a-ChR mouse. (A2) Summary box chart comparing the peak amplitude of the optogenetically evoked EPSCs in control (ctrl) versus animals exposed to environmental enrichment (EE). (B1) Optogenetically evoked EPSCs in interneurons recorded from slices obtained from control versus treated animals have similar kinetic properties and latencies. Averaged scaled traces of all the recordings in control mice (dark yellow trace, left) and in animals exposed to enriched conditions (red trace, right). Traces are superimposed in the bottom right inset: notice the similar kinetics and latency. (B2) Population plot for EPSC latencies measured in the 2 groups of animals. (C1–C3) Similar location and dendritic properties of postsynaptic interneurons receiving Cajal–Retzius cell-generated synaptic input suggests that the different amplitude of optogenetic responses does not depend on postsynaptic differences. (C1) NEUROLUCIDA reconstruction of 32 interneurons in slices from control (ctrl, n = 16, dark yellow) vand treated mice (EE, n = 16, red). Notice the similar localization along the hippocampal fissure. GCL, granule cell layer; ML, molecular layer; SLM, stratum lacunosum-moleculare; SR, stratum radiatum; SP, stratum pyramidale. (C2) Quantitative analysis of the dendritic length measured in the reconstructed cells does not reveal significant differences between control (ctrl) versus treated (EE) groups. (C3) Dendritic complexity evaluated by Sholl analysis for mice housed under standard (ctrl) and enriched conditions (EE). Notice the lack of significant differences.

