
Figure 2.
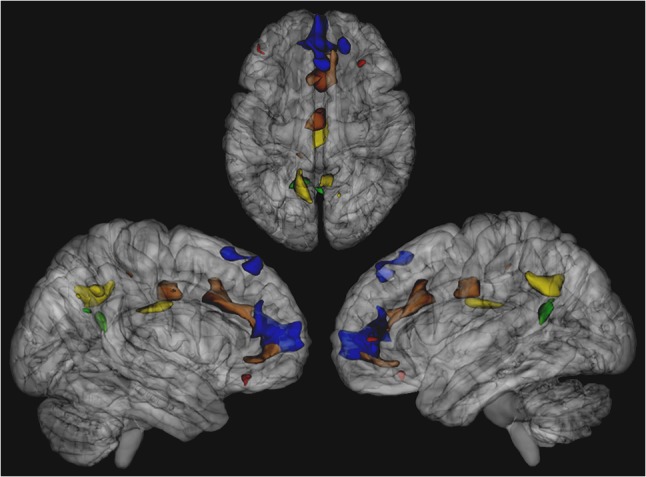
Cluster locations of significant 22q11DS within-ICN hypoconnectivity for various networks, derived from the UCLA cohort. ACC/Precuneus Network rendered in blue, combined executive network rendered in red, DMN rendered in green, posterior DMN rendered in yellow, salience network rendered in brown.