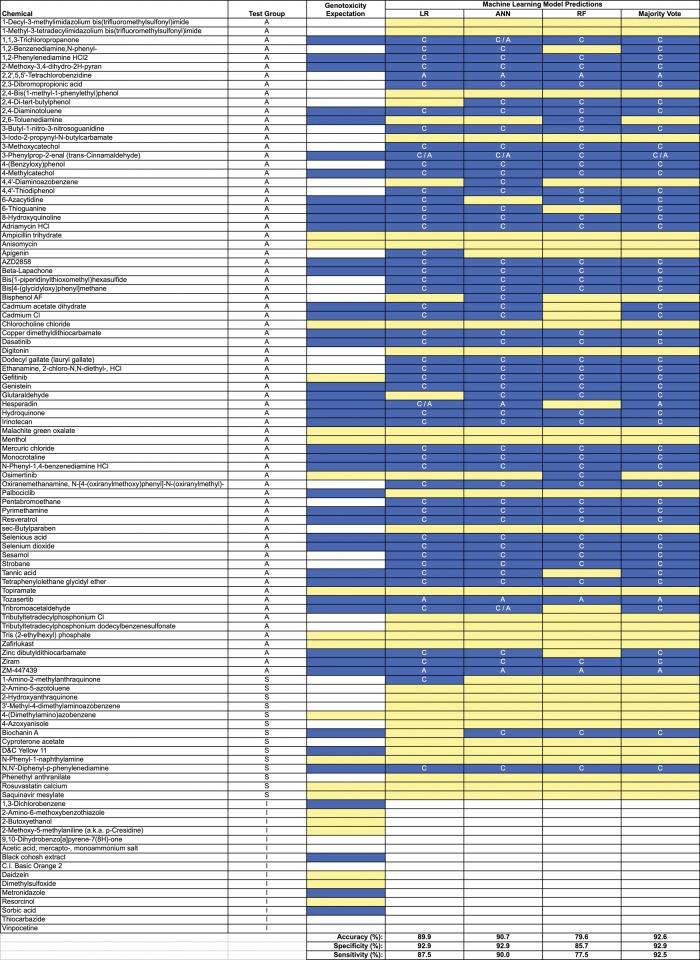
Figure 4.
Information on 103 chemicals including expected and observed in vitro mammalian cell genotoxicity results is provided. Chemicals are grouped according to class: A, adequately tested; S, top concentration limited by solubility; I, inadequately tested. White cells in the “Genotoxicity Expectation” column indicate there is too little conventional genotoxicity data to form an opinion about DNA damage potential; yellow cells (gray in print version) denote a nongenotoxic expectation, and blue cells (black in print version) indicate an expectation of in vitro genotoxic activity in the absence of metabolic activation. Observed results are provided in the 4 right-most columns and are based on MultiFlow assay data in conjunction with LR, ANN, and RF models, as well as a majority vote ensemble. In these columns white cells indicate that no call could be made due to inadequate testing (stock chemical concentration provided was too low); yellow cells (gray in print version) indicate a negative result; and blue cells (black in print version) denote a positive call. Note that when a genotoxic call was made, the following abbreviations indicate the predicted MoA: C, clastogen, A, aneugen, C/A, evidence of both. The performance metrics shown at the bottom are based on A and S class chemicals with a negative or positive genotoxicity expectation (n = 54).

