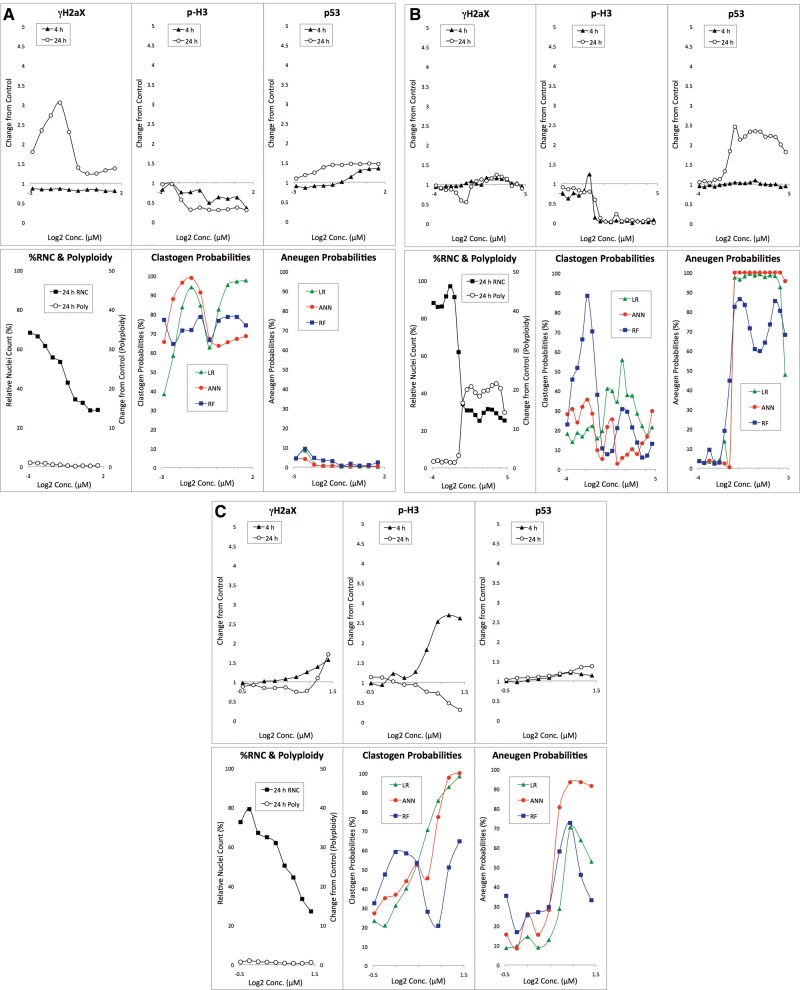
Figure 5.
A, Biomarker response data are graphed for 6-thioguanine-exposed TK6 cells versus concentration. The bottom middle panel shows clastogen probabilities as a function of 6-thioguanine concentration based on 3 machine learning algorithms: LR, ANN, and RF. The bottom right panel shows analogous aneugen probability scores. B, Biomarker response data are graphed for ZM-447439-exposed TK6 cells versus concentration. The bottom middle panel shows clastogen probabilities as a function of ZM-447439 concentration based on 3 machine learning algorithms: LR, ANN, and RF. The bottom right panel shows analogous aneugen probability scores. C, Biomarker response data are graphed for tribromoacetaldehyde-exposed TK6 cells versus concentration. The bottom middle panel shows clastogen probabilities as a function of tribromoacetaldehyde concentration based on 3 machine learning algorithms: LR, ANN, and RF. The bottom right panel shows analogous aneugen probability scores.

