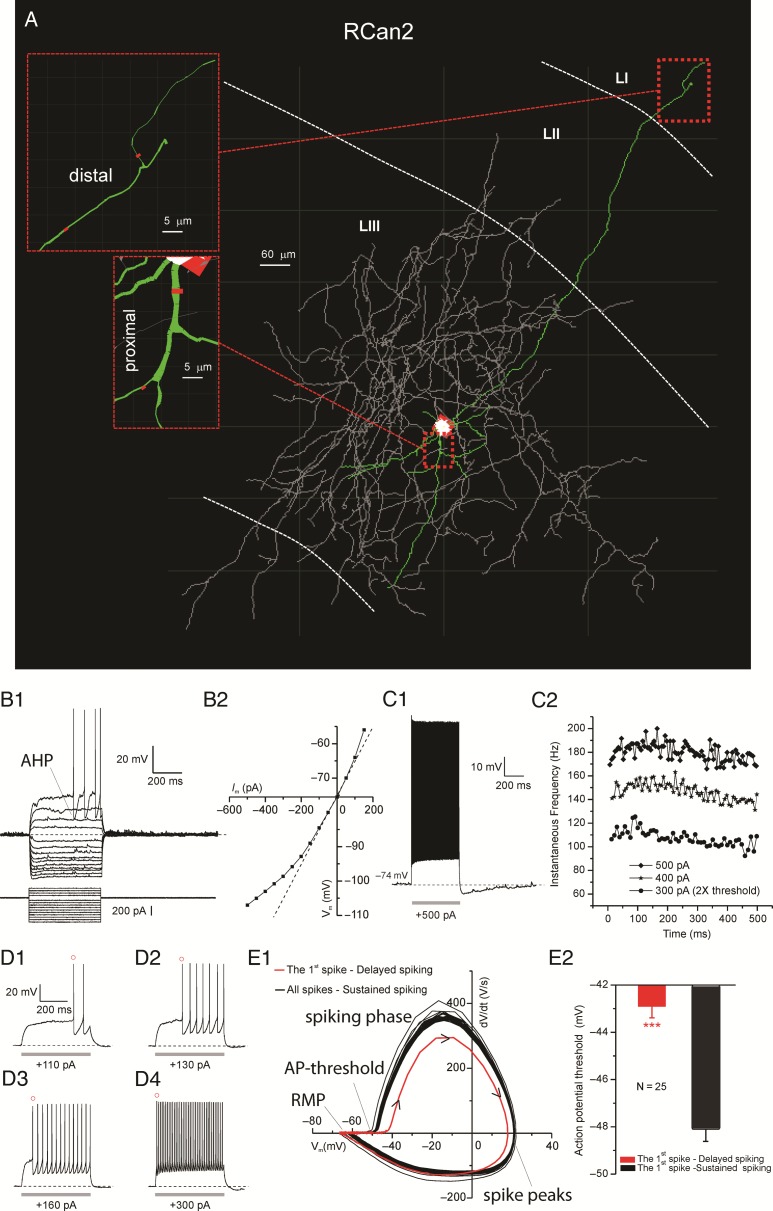
Figure 3.
Intrinsic properties of RCan2+ interneurons. (A) Neurolucida 3D reconstruction of an EC RCan2+ interneuron with dendrites (in green), soma (in white), and axon (in gray). Insets show fine morphological details (e.g., branch diameter, in red) for proximal and distal branches. (B1) Voltage responses to a series of hyperpolarizing and then depolarizing current pulses up to rheobase. Note the large fast AHP characterizing this class of interneurons. (B2) Current–voltage (I–V) relations for each voltage response in B1. (C1) Characteristic RCan2+ spiking response to suprathreshold current injection. (C2) Time course of the spike-frequency adaptation for 3 samples of input currents. (D1–4) Delay of the first AP as function of the stimulus amplitude. Note AHP becomes smaller as the stimulus strength increases. (E1) Phase plot depicting the phases of the somatic spikes from the resting membrane potential (RMP), to the AP-threshold, through the spiking phase and spike peak all the way back to the RMP. Kinetics of the first AP shown in red with black arrow heads showing the direction of the temporal progression of the spike. (E2) Significant difference in the voltage threshold for the first and subsequent APs.

