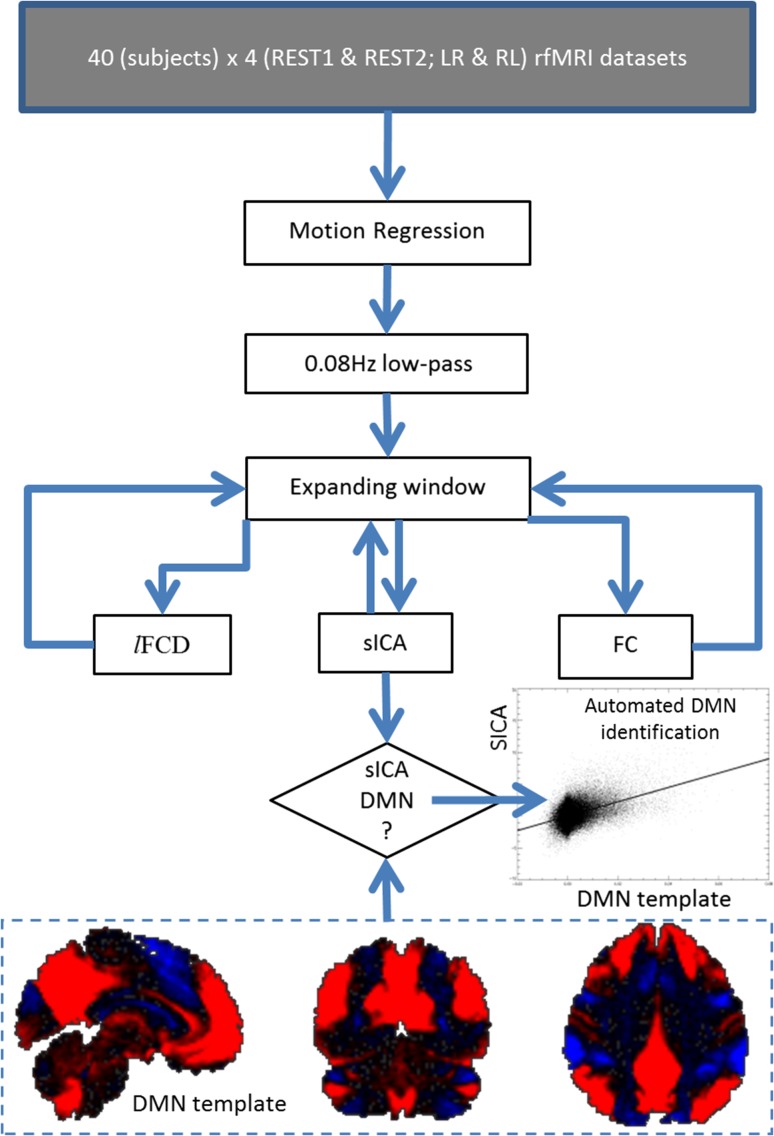
Figure 1.
Image processing pipelines. Dynamic lFCD, sICA, and FC maps with 2-mm isotropic resolution and 91 × 109 × 91 voxels were computed for each subject, session, and phase encoding direction using 160 HCP data sets with low-pass filtered “minimally preprocessed” data (Glasser et al. 2013) from the Q1 release and an expanding-window approach (see text). The DMN template (bottom) used for automated DMN identification reflects the average of 260 DMN maps and shows the standard DMN pattern (red) and its anticorrelated network (blue) superimposed on the human brain (black).

