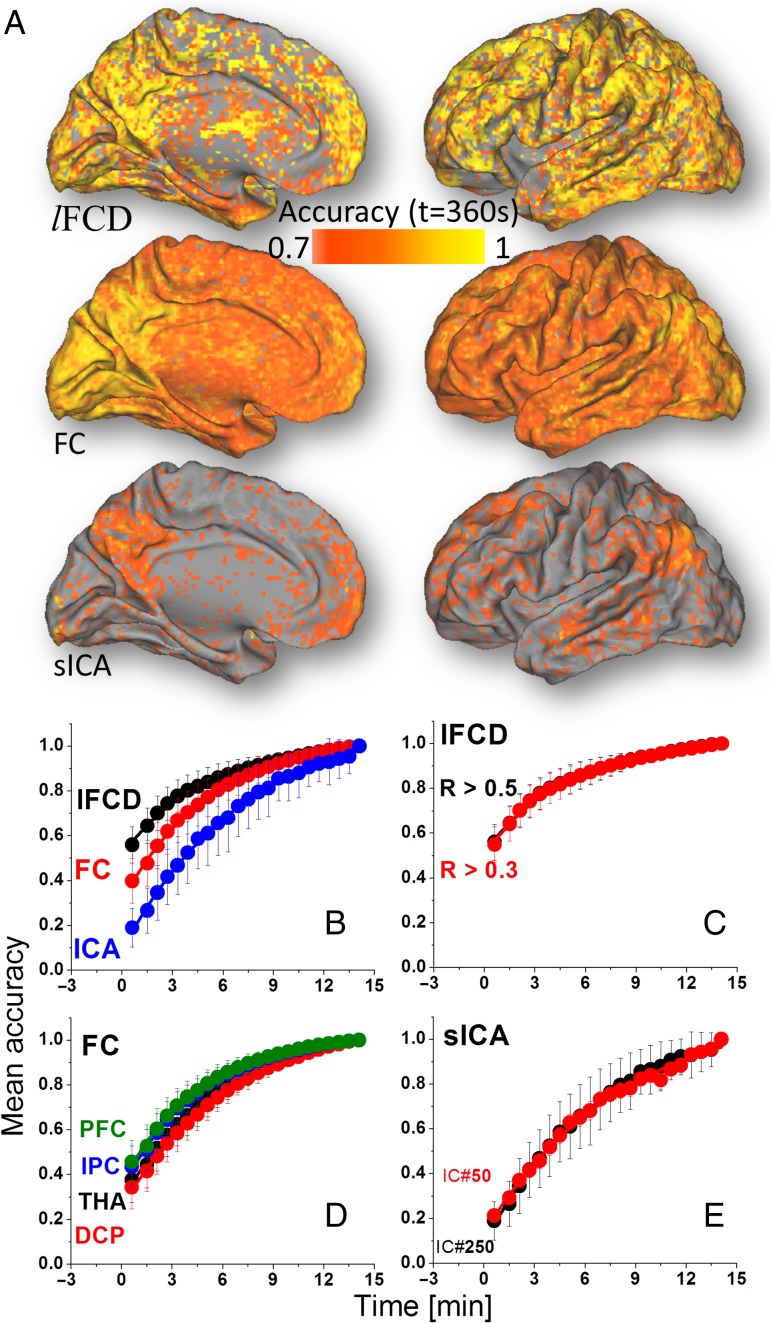
Figure 3.
(A) Spatial distribution of the accuracy computed across subjects at t = 6 min, independently for each metric (lFCD, FC, sICA). Whole-brain average accuracy as a function of time for: lFCD, FC, and sICA (B); lFCDHT (R > 0.5) and lFCDLT (R > 0.3) (C); seed-voxel correlations for seed regions in THA, DCP, IPC, and dorsolateral PFC (D); and for sICA-DMN maps computed using 50 and 250 maximum independent components (E). Average values computed across two rfMRI sessions (REST1 and REST2) and two phase encoding directions (LR and RL). Bars reflect standard errors.

