Figure 7.
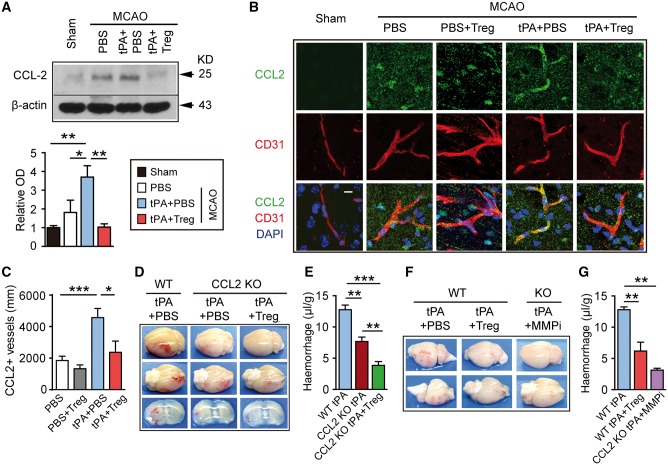
CCL2 is another target for Treg-afforded BBB protection in tPA-treated stroke mice. (A) Western blot analysis of CCL2 1 day after stroke in mice treated with PBS, tPA+PBS, or tPA+Treg. β-actin was used as the loading control (n = 3/group). Data are normalized to sham. (B) Representative confocal image of CCL2 and CD31 double immunostaining in the brains obtained from MCAO mice treated with PBS, PBS+Treg, tPA+PBS, or tPA+Treg. Scale bar = 10 µm. (C) Quantification of the length of CCL2+/CD31+ blood vessels in the brain (n = 4/group). (D) Representative images of the dorsal and ventral surfaces of the brain and coronal sections showing cerebral haemorrhages 1 day after stroke in wild-type mice treated with tPA or CCL2 −/− mice treated with tPA+PBS or tPA+Treg. (E) Quantification of cerebral haemorrhage by spectrophotometric haemoglobin assay for each group in E (n = 4–6/group). (F) Representative images of the dorsal and ventral surfaces of the brain showing cerebral haemorrhages 1 day after stroke in wild-type mice treated with tPA+PBS or tPA+Treg, and in CCL2−/− mice treated with tPA+MMP9 inhibitor (SB-3CT, 25 mg/kg). (G) Quantification of cerebral haemorrhages by spectrophotometric haemoglobin assay for each group in F (n = 4–5/group). Data are mean ± SE. *P ≤ 0.05; **P ≤ 0.01; ***P ≤ 0.001.

