Figure 3.
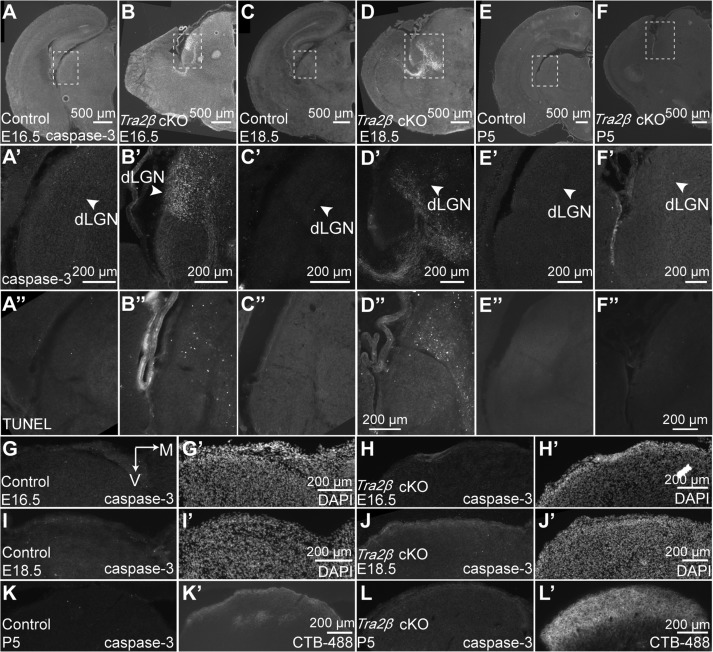
Apoptosis in the dLGN cells and thalamocortical pathway in Tra2β cKO mice. (A–B″) Immunohistochemistry for cleaved caspase-3 and TUNEL staining at E16.5 in the cortex and dLGN of control and Tra2β cKO mice respectively. (C–D″) Immunohistochemistry for cleaved caspase-3 and TUNEL staining at E18.5 in the cortex and dLGN of control and Tra2β cKO mice. (E–F″) Immunohistochemistry for cleaved caspase-3 and TUNEL staining at P5 in the cortex and dLGN of control and Tra2β cKO mice. (A′–F′) High magnification images of the areas labeled by white dotted lines in A–F, respectively. (G–L′) Immunohistochemistry for cleaved caspase-3 and DAPI staining or CTB labeling at E16.5, E18.5, and P5, respectively, in SC of control and Tra2β cKO mice.

