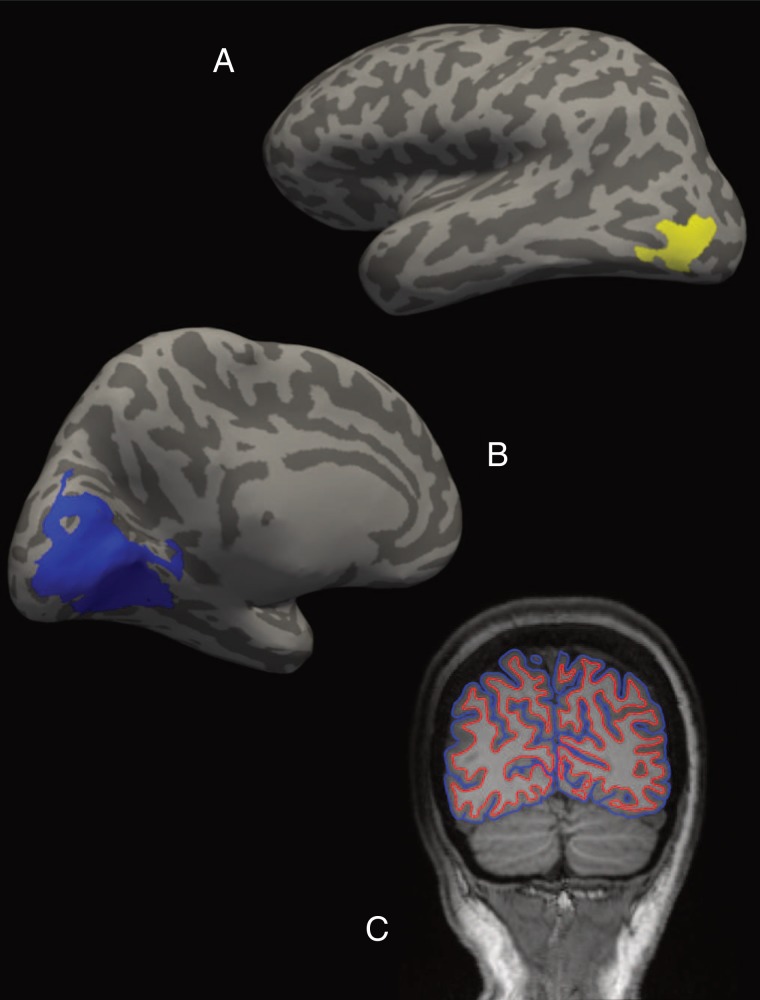
Figure 1.
Individualized visual ROIs and cortical boundaries for an example participant (healthy control). (A) LOC (in yellow) on an inflated lateral view of the left hemisphere. (B) Location of early retinotopic visual cortex (in blue) on an inflated medial view of the left hemisphere. (C) Coronal slice transecting the two visual ROIs from the participant's structural scan (radiological coordinates). White matter/gray matter and gray matter/pia mater boundaries are depicted in red and blue, respectively. ROI cortical thickness was calculated as the mean distance between these two boundaries within that area of the cortical surface.

