Figure 2.
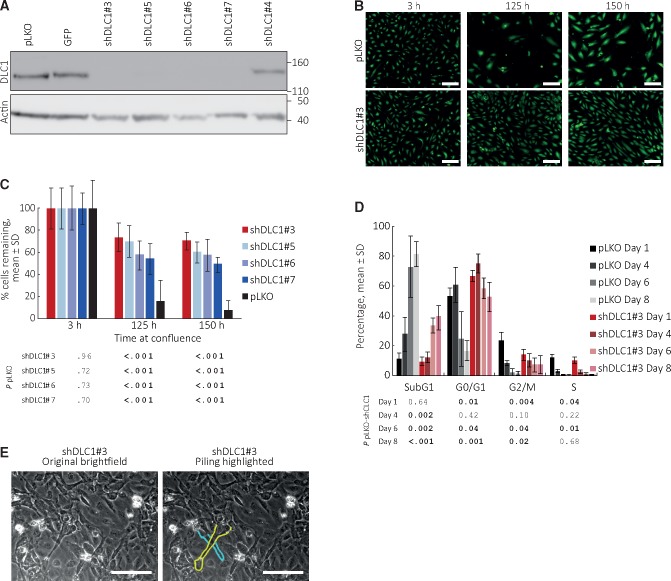
Effects of Deleted in Liver Cancer 1 (DLC1) on endothelial cell death. A) DLC1 silencing by distinct shRNAs. pLKO identifies the empty vector control for all DLC1 shRNAs; GFP identifies an empty vector where the puromycin marker of pLKO is substituted by the GFP reporter. Immublotting results. B and C) DLC1-silenced and control human umbilical vein endothelial cells (HUVEC) were seeded as confluent monolayers and incubated for 150 hours. B) Representative fluorescent images of calcein-labeled viable cells (10×). C) Percent remaining cells is statistically significantly increased in DLC1-silenced HUVEC compared with control after incubation at confluence (125- and 150-hour time points); means (SD) (one experiment, 32 replicates; results of statistical analysis by two-sided Student’s t test are shown in tabular form below the bar graph; representative of five independent experiments with shDLC1#3; remaining cells ranged between 10% and 40% in control; 40% and 80% in DLC1-silenced cells). D) Cell cycle distribution of DLC1-silenced and control HUVEC seeded as confluent monolayers and evaluated on days 1, 4, 6 and 8; the bar graphs reflect the mean (SD) (n = 4 experiments); the table shows the statistical significance of group differences at each time point. P values by two-sided Student’s t test. E) Cell piling in DLC1-silenced HUVEC after four-week culture at confluency; bright field images (20×); the cytoplasmic membrane of two overlapping cells is contoured (on the right). Scale bars: B = 50 μm; E = 80 μm. DLC1 = Deleted in Liver Cancer 1.

