Figure 6.
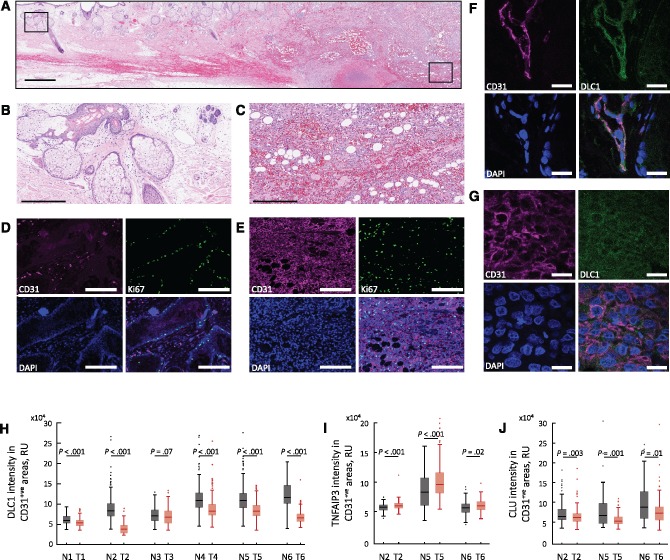
Deleted in Liver Cancer 1 (DLC1) in human angiosarcoma and normal endothelium. Histology of angiosarcoma section containing normal and tumor cells; hematoxylin and eosin staining (A); boxed areas magnified in ((B) normal) and ((C) tumor). CD31 and Ki67 immunostaining (D and E) shows that the normal CD31+ endothelial cells are mostly nonproliferative (some CD31- cells, likely gland-associated are Ki67+ in (D), whereas CD31+ tumor cells are Ki67+(E)). CD31+ normal endothelium is DLC1+(F); DLC1 levels in angiosarcoma (G). Quantitative analysis of DLC1 fluorescence intensity in CD31+ regions within areas of normal and tumor tissue in individual angiosarcoma tissue biopsy specimens (H). Quantitative analysis of TNFAIP3/A20 (I) and clusterin (J) fluorescence intensity in CD31+ regions of six individual biopsies from six patients, including normal and tumor areas. The box-and-whisker plots in (H and I) reflect the distribution of data points (box bottom: first quartile; box top: third quartile; horizontal line: median; whiskers: lowest and highest data points within 1.5 times the interquartile range). Statistical significance shown in (H–J) is from Mann-Whitney U test. Scale bars: A = 1 mm; B and C = 300 μm; D and E = 200 μm; F and G = 20 μm. CLU = clusterin; DLC1 = Deleted in Liver Cancer 1 (DLC1); N = normal; T = tumor.

