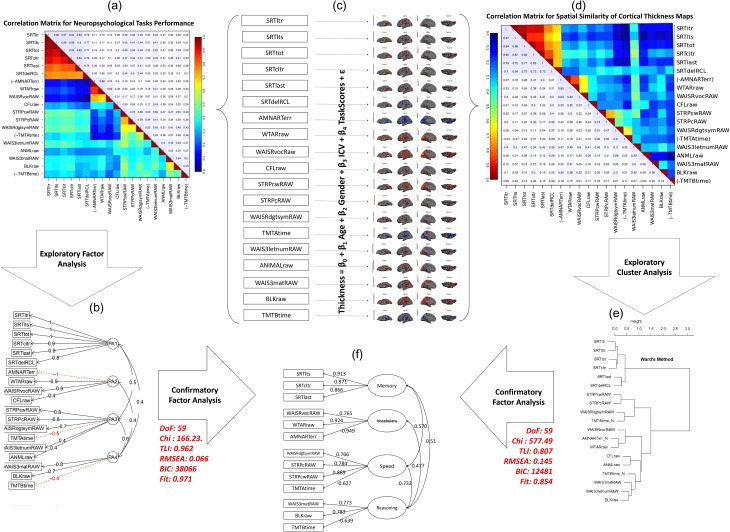
Figure 1.
Cognitive factor structure recapitulated by spatial similarity matrix of associated cortical thickness maps. (a) Correlation matrix obtained from neuropsychological test scores in a number and heat-map color code. (b) Structure of four factors obtained by exploratory PAF analysis of the cognitive data for loadings higher than 0.3 (fit statistics are given in Supplementary Fig. S3). (c) Cortical thickness maps (masked by uncorrected significance level of p < 0.05) associated with each neuropsychological test when age, gender and ICV are taken into account. (d) Spatial similarity matrix in a number and heat-map color code in which the elements reflect pair-wise spatial similarity of the cortical thickness maps obtained in part c. Spatial similarity is measured by Pearson correlation coefficient between beta coefficient of the significant vertices. (e) Exploratory cluster analysis performed on the spatial similarity matrix. (f) Final factor structure obtained from neuropsychological data, validated with their cortical thickness maps and fine-tuned with modification index and simplest rule. The two side arrows indicated the fit statistics of the neuropsychological correlation matrix and the spatial similarity matrix on the final factor structure using confirmatory factor analysis.

