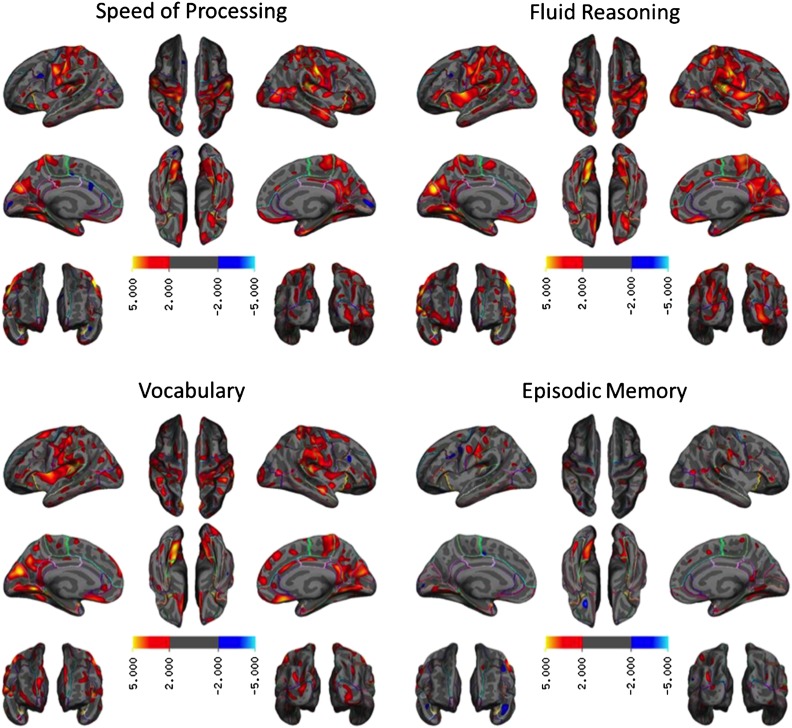
Figure 3.
Cortical thickness maps associated with each cognitive domain score. The expressions are t statistics and non-significant vertices (uncorrected p < 0.01) are masked out. There were no or few negative relationships between domain scores and cortical thickness. None of the negative relationships survived after correcting for multiple comparisons.

