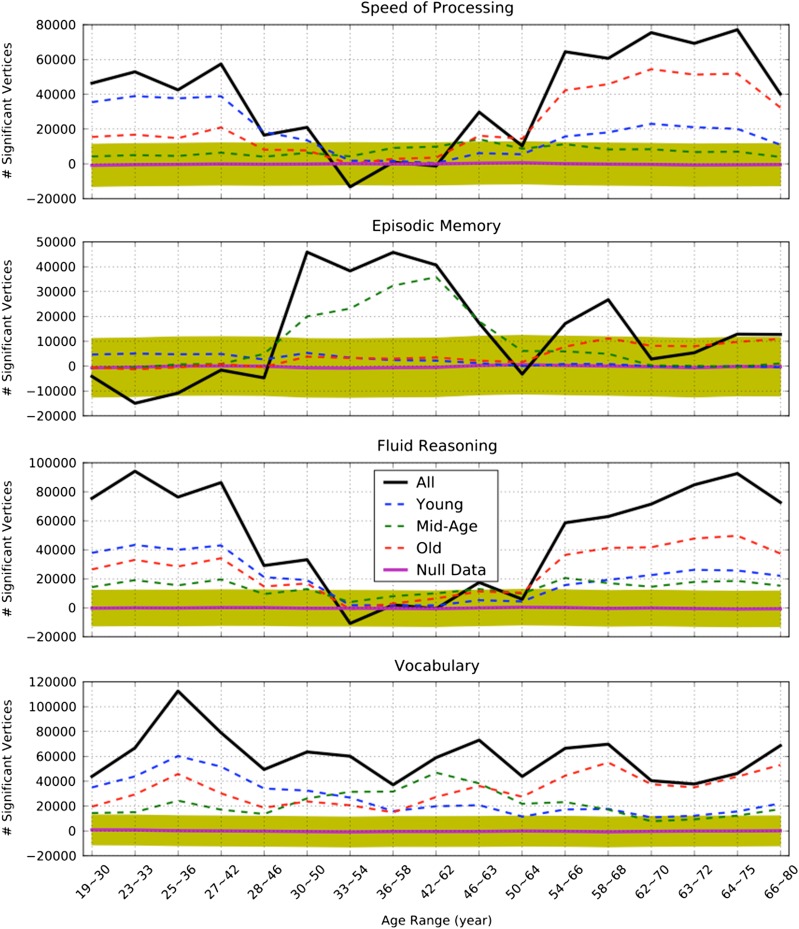
Figure 6.
The age-dependence of the cortical thickness–cognition relationship illustrated by the number of significant vertices predicting each cognitive domain score at difference steps of the sliding window, with and without masking out the regions that are shown to be significant at each age group. Positive numbers indicate a dominantly positive association between cortical thickness and cognition whereas negative numbers show a dominantly negative association between cortical thickness and cognition. A black solid-bold curve shows the total number of significant vertices (uncorrected p < 0.05) predicting each cognitive domain at each step of the sliding window. A blue dash-line curve shows the number of significant vertices within the regions where thickness significantly predicted young participants performance (shown in Fig. 5. Red/green dashed-line curves show the number of significant vertices within the regions where thickness significantly predicted old/mid-age participants’ performance (shown in Fig. 5). A magenta bold-solid line shows the mean of the number of vertices predicting cognition when participants are permuted at each step of the sliding window; the yellow color shaded area depicts 95% confidence interval.

