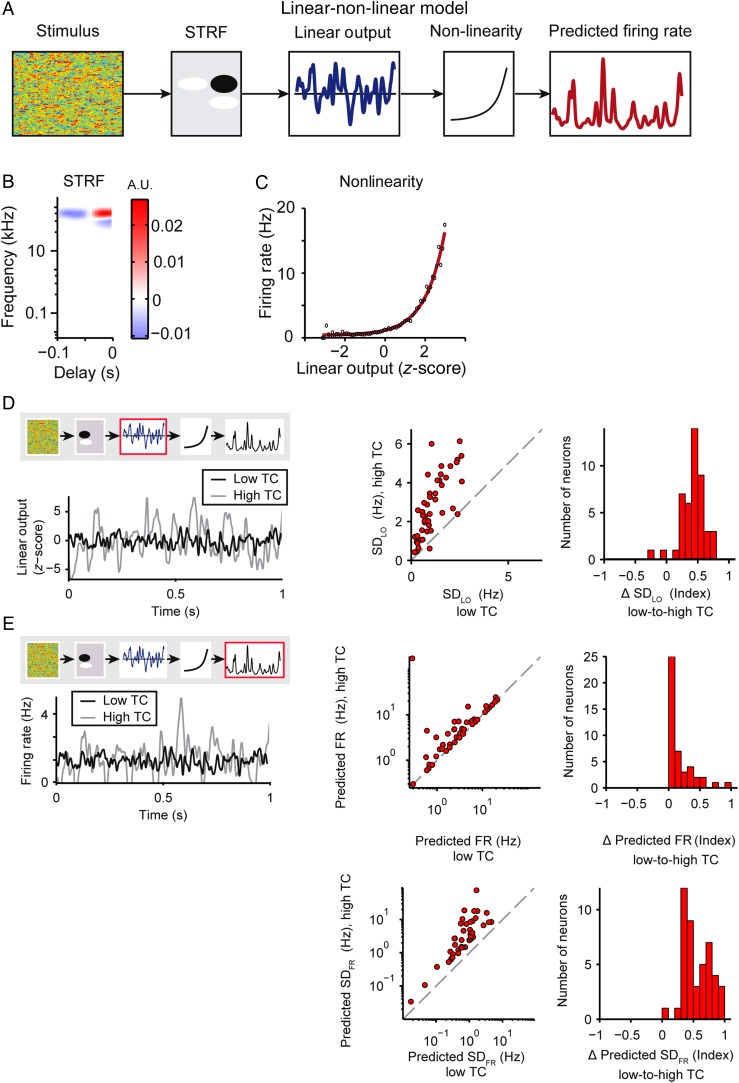
Figure 3.
Predicted increase in neuronal responses with increased stimulus TC. (A) Linear–nonlinear model diagram illustrating how the model predicts the firing rate in response to input stimulus: Amplitude modulation envelope of the stimulus is convolved with the linear filter (STRF) to produce the linear output, (Equation 2), which is subject to a transfer function (exponential fit to the nonlinearity) to generate the predicted firing rate for the neuron (Equation 3). (B) Sample STRF. (C) Sample nonlinearity (red: exponential fit, black: data). (D,E) Model predictions for responses to low or high stimulus TC levels. Left panels: Example of model outputs fitted to a single neuron's TC stimulus response properties. The red box in the model diagram highlights the feature being analyzed. Middle: Single neuron responses. Right: Population histogram of the change in predicted response with increased stimulus TC. (D) Standard deviation of the linear output (SDLO, Equation 2) of the low TC model in response to low or high TC stimuli. (E) Predicted mean firing rate (top) and standard deviation (bottom) (Equation 3) of the low TC model in response to low versus high TC stimuli. Fit to low TC responses: black; fit to high TC responses: gray. Here and below: unity line: gray dashed.

