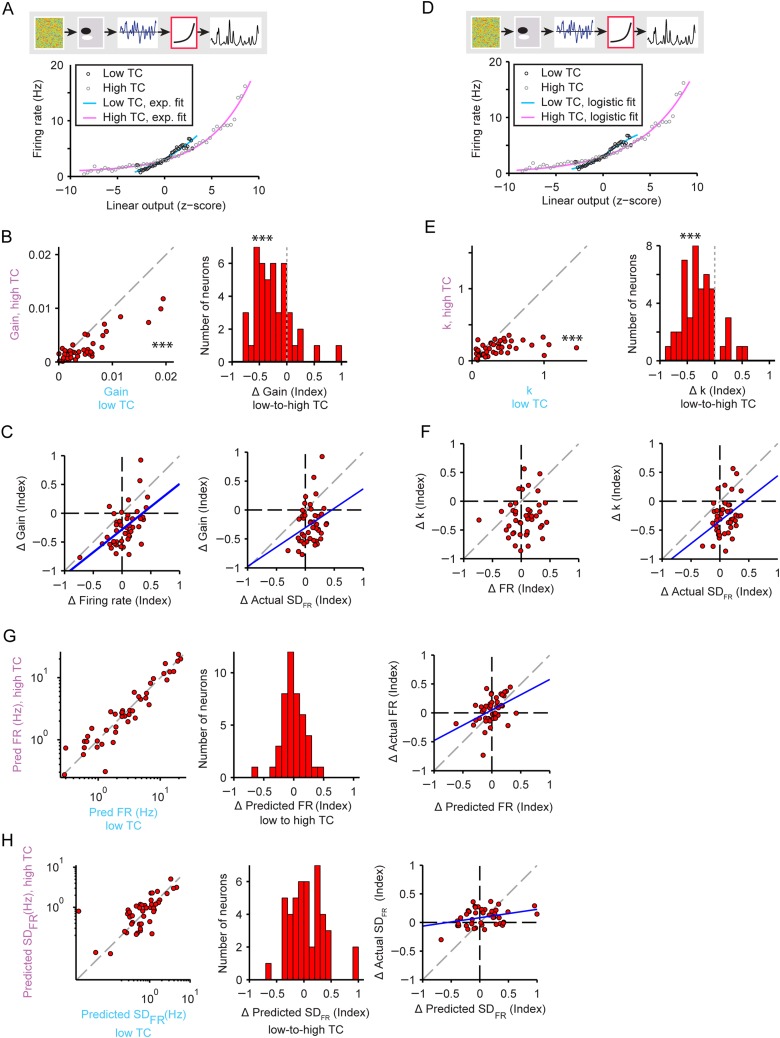
Figure 5.
Gain adaptation in neuronal responses to stimuli with increased temporal correlation. (A) Exponential nonlinearity fitted to the actual firing rate response to low versus high TC stimuli. Gain is measured through a linear fit to the exponential. Cyan: low TC fit, Magenta: high TC fit. Responses to low TC stimulus: black circles; responses to high TC stimulus: gray circles. (B) Gain measurements for high versus low TC stimuli. Left: individual neurons, right: histogram of change in the gain. Stars indicate that gain was higher for low TC than for high TC stimuli (left panel) and that gain decreased upon transition from high to low TC stimuli (right panel). (C) Change in the gain versus the change in the firing rate (left) or the standard deviation of the firing rate (right). (D, E, F) Same as in (A), (B), (C) but with logistic nonlinearity fit. Gain is measured as the steepness parameter k in Equation 5. (G) Predictions for the firing rate based on models fitted to high versus low TC stimulus. Left: individual neurons. Center: histogram of the index of change of the predicted firing rate with increasing TC. Right: actual versus predicted change in firing rate. (H) Predictions for the standard deviation of the firing rate based on models fitted to high versus low TC stimulus. Panels same as in G.

