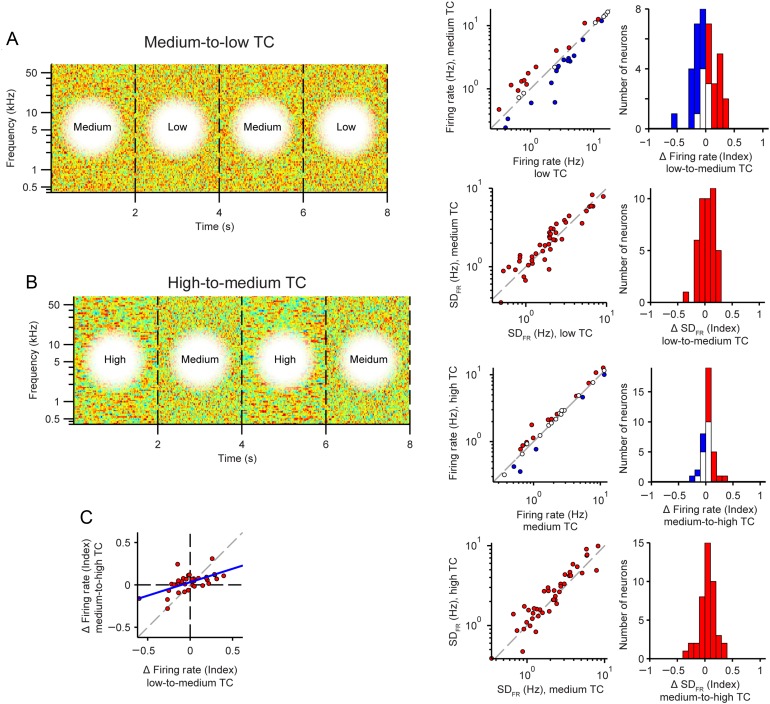
Figure 6.
Neuronal firing rates in response to intermediate TC-level changes. (A) Transition from low to medium TC. (B) Transition from medium to high TC. (A, B) Left: Stimulus envelope, as in Figure 5A. Right: Change in mean firing rate (top) and standard deviation of the firing rate (bottom) from low to high TC stimulus. Axes and colors same as in Figure 4B,C. (C) Correlation between change in mean firing rate for medium-to-low and high-to-medium TC stimuli.

