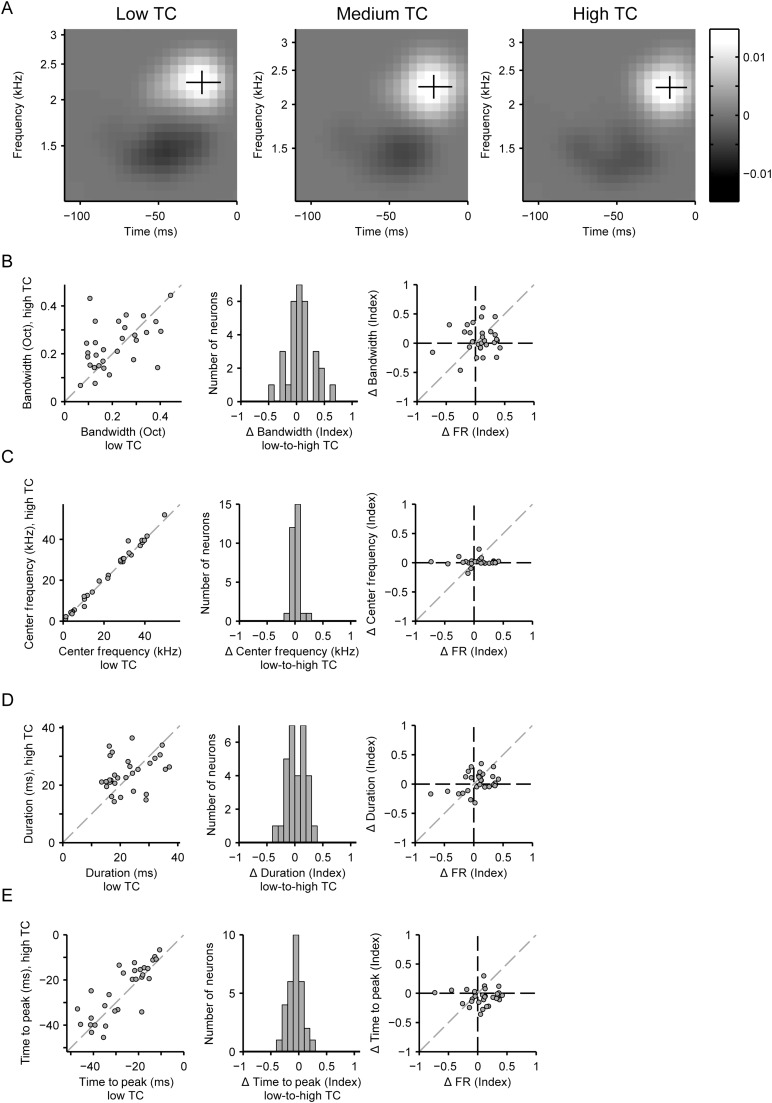
Figure 7.
Neuronal spectrotemporal receptive fields remain stable across varying temporal correlation levels. (A) Spectrotemporal receptive field (STRF) of a neuron in response to low (left), medium (middle), and high (right) stimulus TC levels. Excitatory lobe: white, inhibitory lobe: black. Excitatory lobe bandwidth: vertical line. Excitatory lobe duration: horizontal line. The intersection of the black lines marks the excitatory lobe center frequency and time to peak. (B–E) Analysis of model parameters (positive lobe of the linear filter) in response to high-to-low stimulus TC levels for each neuron. (B) Frequency bandwidth. (C) Center frequency. (D) Duration. (E) Time to peak. (B–E) Left: Single neuron data. Center: Population histogram. Right: Correlation between the change in the STRF parameter versus the change in the firing rate with increased TC.

