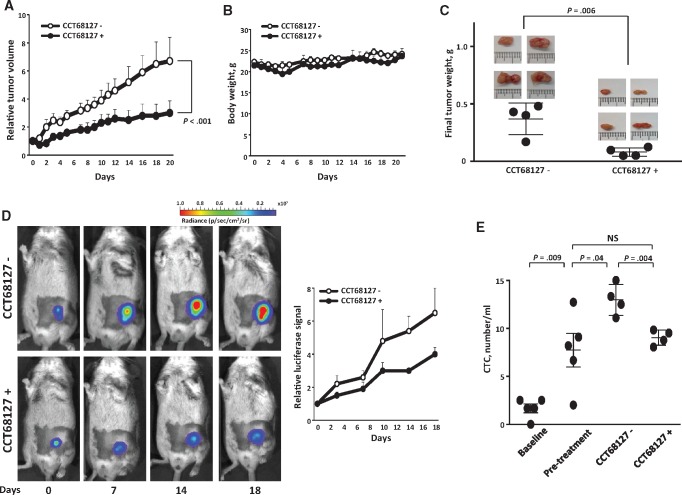
Figure 7.
Antitumorigenic effects of CCT68127 treatments. A) Comparison of lung cancer growth in mice treated with vehicle or CCT68127. Day 0 is the treatment start date. B) Mouse body weights did not appreciably change during vehicle or CCT68127 treatments. Error bars are standard deviation. C) Comparison of tumor weights after treatments with vehicle or CCT68127. Each symbol represents a single mouse. Images of the excised tumors are shown. D) Comparison of bioluminescent signals of syngeneic lung cancers in mice treated with vehicle or CCT68127. Representative bioluminescence images of these mice are shown over time in the left panels. E) Comparison of circulating tumor cell (CTC) numbers within the different groups of mice. The baseline group is mice without tumor cell injections. The pretreatment group was injected with tumor cells subcutaneously, and their CTCs were analyzed before the treatment. CCT68127 negative (-) and CCT68127 positive (+) groups were injected with tumor cells subcutaneously, and CTCs were analyzed after completion of the independent treatments with vehicle or CCT68127, respectively. Bars display mean value in this panel. Error bars represent the standard deviation in all graphs. The P values were computed using the mixed model analysis (A) and t test (B) with multiple comparison adjustment by Tukey's method (E). All statistical tests were two-sided. CTC = circulating tumor cell.

