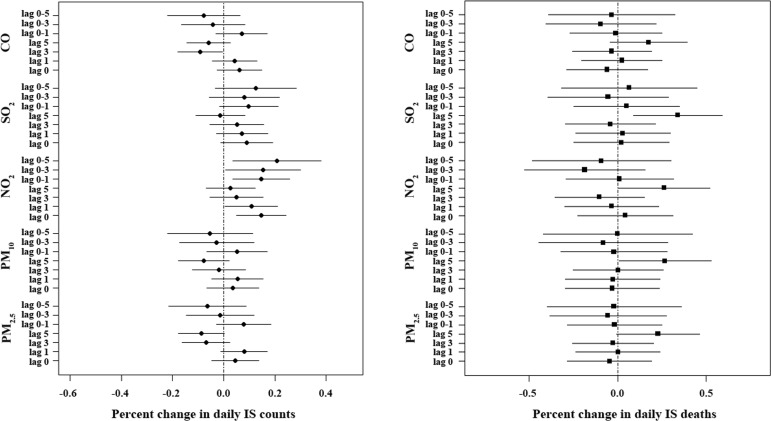
Figure 1.
The percentage change in daily IS counts and daily IS deaths with an IQR increase in air pollutant levels on different lag days in single-pollutant models in Changzhou, 2015–2016. The data are expressed as the mean with a 95% CI. CO, carbon monoxide; IS, ischaemic stroke; NO2, nitrogen dioxide; PM2.5, particulate matter <2.5 µm in diameter; PM10, particulate matter <10 µm in diameter; SO2, sulfur dioxide.

