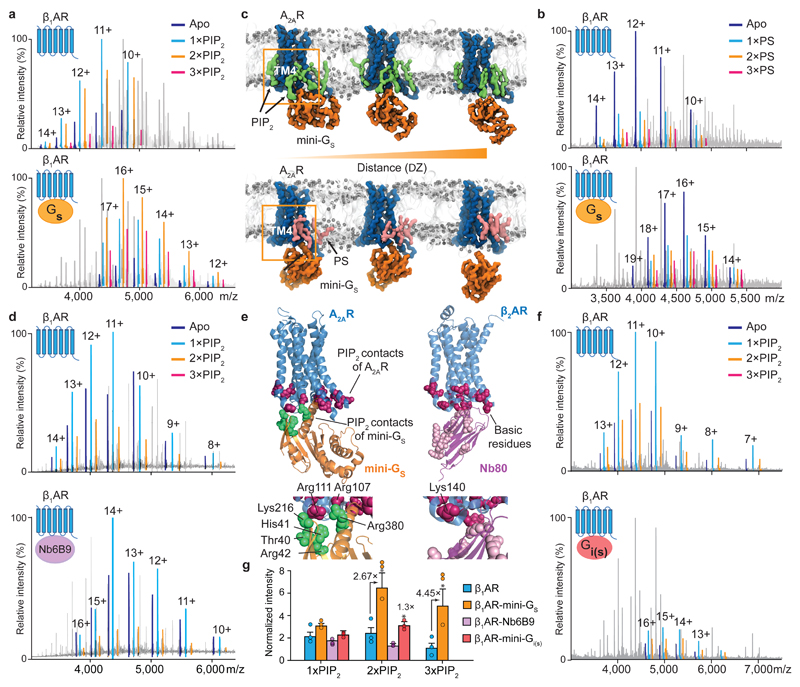
Figure 3. The effect of PIP2 on coupling to mini-Gs, and comparison with PS, a nanobody and mini-Gi.
a, A representative mass spectrum of the β1AR:mini-Gs complex (n=3) in the presence of PIP2 and the agonist isoprenaline with uncoupled β1AR lipid bound states highlighted according to the colour coding (upper) and β1AR:mini-Gs lipid bound states highlighted in the same spectrum (lower). b, A representative mass spectrum of the β1AR:mini-Gs complex (n=3) in the presence of PS and the agonist isoprenaline. No appreciable difference can be attributed to PS binding between β1AR and β1AR:mini-Gs. c, Snapshots of steered MD simulations to pull mini-Gs away from A2AR in the presence of PIP2 (green) and PS (pink). Results reveal different binding modes of PIP2 and PS to the receptor (outlined orange boxes). The interaction of mini-Gs with A2AR is stabilised in the presence of PIP2 by ~50 kJ/mol relative to PS (Extended Data Fig. 6b). d, A representative mass spectrum recorded following incubation of β1AR with PIP2, isoprenaline and a nanobody (Nb6B9) (0.3 molar ratio to receptor, n=3). e, PIP2 contacts of A2AR-miniGs complex are shown on the receptor (purple) and miniG s (Thr40, His41, Arg42, Lys216, Arg380; green), and juxtaposed to basic residues on β2AR-Nb80 complex (purple). f, A representative mass spectrum of PIP2 binding to mini-Gi(s) (n=3). No difference is detected +/- PIP2. g, The intensity ratios of different lipid bound states to the apo state of receptor in the uncoupled/coupled state are plotted. The asterisk denotes a statistically significant difference (p < 0.05) calculated as one-way ANOVA with Dunnett’s multiple comparison test. Error bars represent standard deviations of the mean from three independent replicates.

