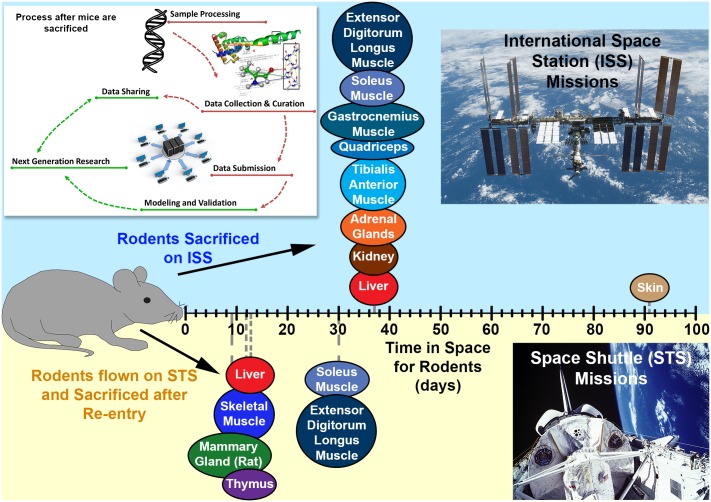
Fig 1. Illustration of methodology and tissues used for analysis.
A schematic representation of the process flow in obtaining the omics dataset from GeneLab database from the tissues used for analyses in this manuscript is shown on the top left. The different tissues have been plotted along an x-axis for the amount of the time the rodents were in space before sacrificing. The upper panel (blue) represents tissues from rodents on the international space station (ISS) and the lower panel (yellow) represents the tissues from rodents on space shuttle missions (STS).

