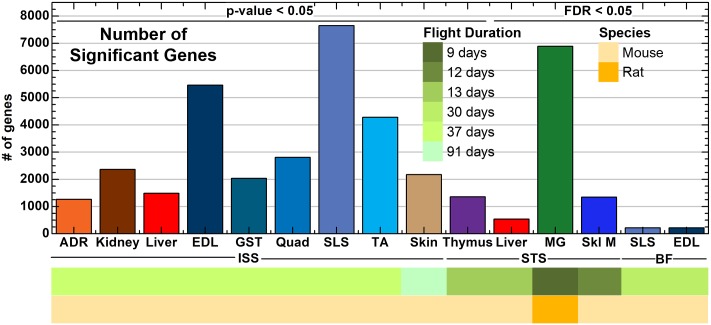
Fig 2. The number of statistically significant genes determined for each tissue and dataset.
A bar plot representing the number of significant genes for each tissue from all datasets either determined by t-test with p-value ≤ 0.05 or with FDR ≤ 0.05. The tissues are separated by the flight conditions for the rodents with ISS = International Space Station, STS = Space Shuttle Mission, and BF = Bion. The color-coded bar on the bottom of the plot represents datasets associated with Flight Duration and Rodent Species.

