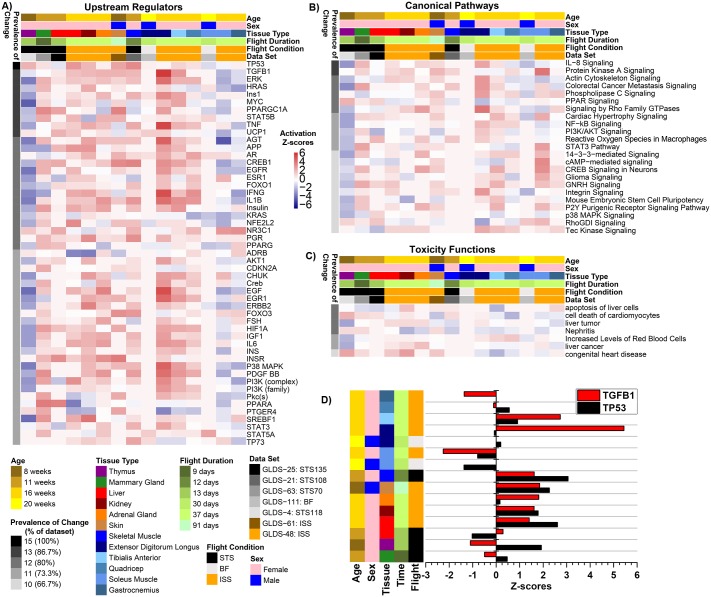
Fig 3. Predicted functions and upstream regulators affected by microgravity.
The predicted statistically significant upstream regulators (A), canonical pathways (B), and toxicity functions (C) determined through IPA from data for each individual tissue/dataset using activation Z-score statistics. Heat map representation of the activation Z-score values (red = positive activation Z-score for activation and blue = negative activation Z-score for inhibition) were used to display the data. The prevalence of change (or % of dataset) on the left side of the heat maps represents how common that factor is throughout all datasets/tissues with the darkest color representing factors with the highest degree in common. Age, sex, tissue type, time in flight, flight conditions, and gene lab dataset reference is color coded on the top of the heat maps. For the upstream regulators (A) each major cluster of upstream regulators is further analyzed for the major functions it will impact represented by the Resulting Pathways. D) A bar graph representing predicted activity of TGF-β1 and TP53 through z-score statistics comparing tissue type, time of flight, and flight conditions, age and sex of the animals.

