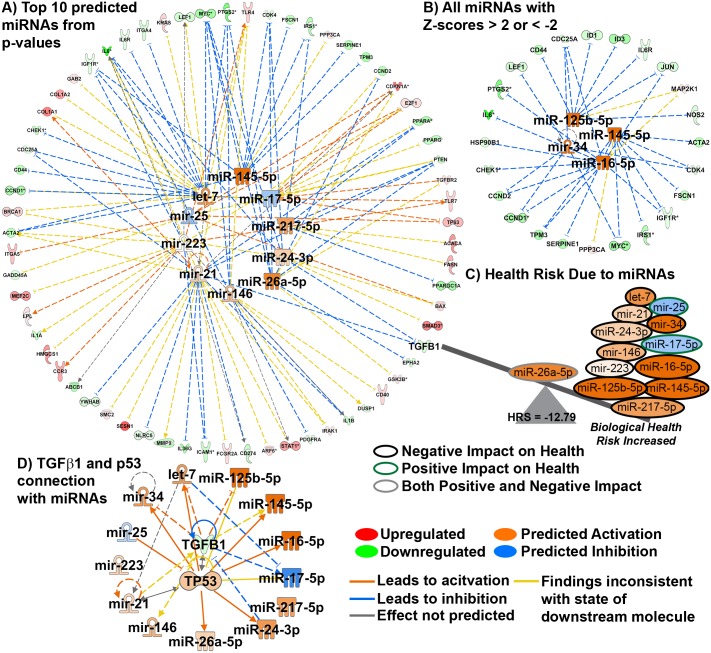
Fig 7. A microgravity associated circulating miRNA signature.
A) A radial plot showing the top 10 predicted miRNAs with p-values ≤ 1.17 × 10⁻⁸ determined from all key genes and the key genes directly related the miRNAs. B) All statistical significant miRNAs predicted from all key genes with activation Z-score ≥ 2 or ≤ -2 and the corresponding key genes associated with these miRNAs. The predicted activity of each miRNA (blue = inhibition and orange = activation) was determined through activation Z-score statistics through IPA. C) A graphical representation of the health risk score (HRS) illustrating how each miRNA contributes to the calculation. The outline for each miRNA represents if the miRNA has a negative impact on health (black), positive impact on health (olive), and has both positive and negative impact on health (grey). D) Radial plot connecting TGFβ1 with p53 and all miRNAs. Through activation Z-score statistics in IPA it was determined that p53 will be activated due to the impact of TGFβ1 and the miRNAs.

