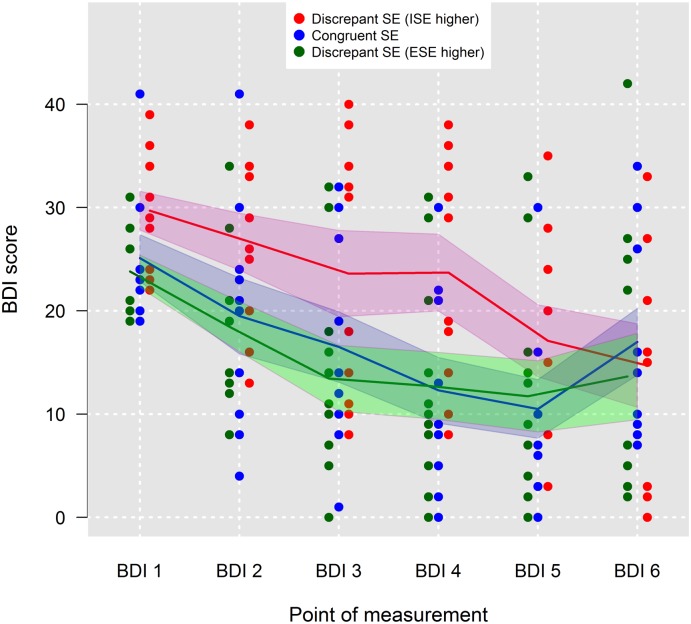
Fig 4. Fitted mean trends of Beck Depression Inventory (BDI) scores for patients grouped by means of 33.3% percentiles of the distribution of the difference between ESE and ISE into patients with congruent self-esteem (n = 10) and into patients holding one of two types of discrepant self-esteem, that is, higher implicit self-esteem than explicit-self-esteem (n = 11) and higher explicit self-esteem than implicit-self-esteem (n = 10).
Red, blue and green shaded areas are 95% confidence intervals; SE = self-esteem.

