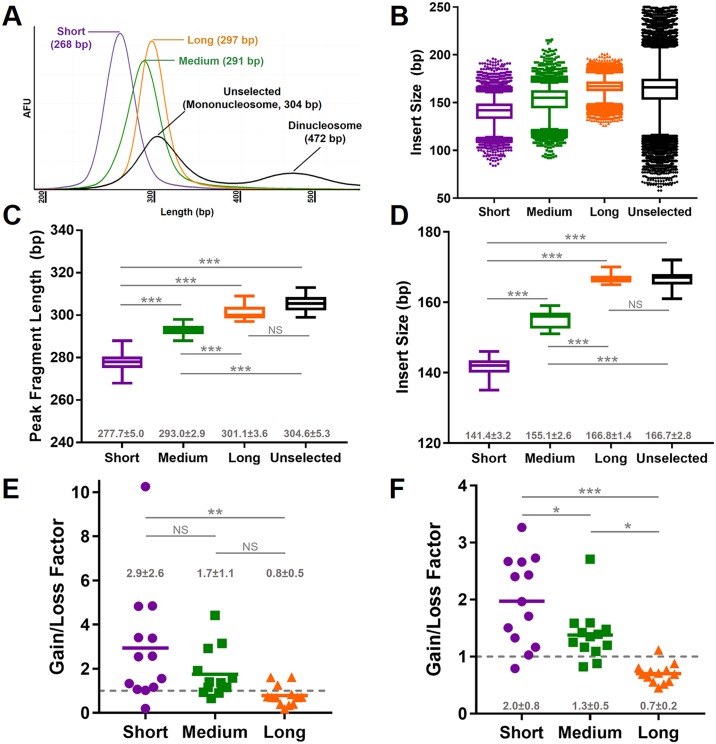
Fig 3. Enrichment of variant alleles in short ccfDNA fractions.
In (A), representative distributions by densitometry are shown of the isolated fractions (short—purple; medium—green; long—orange) from the original ccfDNA (black) of a single cancer patient. The fragment lengths include full-length adapters (~135 bp). The cumulative distribution of insert sizes at variant locations from all patients for each subfraction (B) show a profile consistent with densitometry (A). The peak fragment lengths from each patient by densitometry (C) and the median insert size by sequencing (D) were statistically significantly different between each respective subfraction, while observations for the long fraction were similar to the unselected mononucleosome (black). Enrichment for variant alleles was greatest in the short fraction by both ddPCR (E) and sequencing (F) with intermediate enrichment in the medium fraction (F). In the long fraction analyzed by both modalities there was a tendency for reduction in VAF (E and F). Solid bars represent the mean value. In (C-E), mean±SD values are shown in gray. * P < 0.05; ** P ≤ 0.01; *** P ≤ 0.001; NS = not significant; AFU = arbitrary fluorescent unit.

