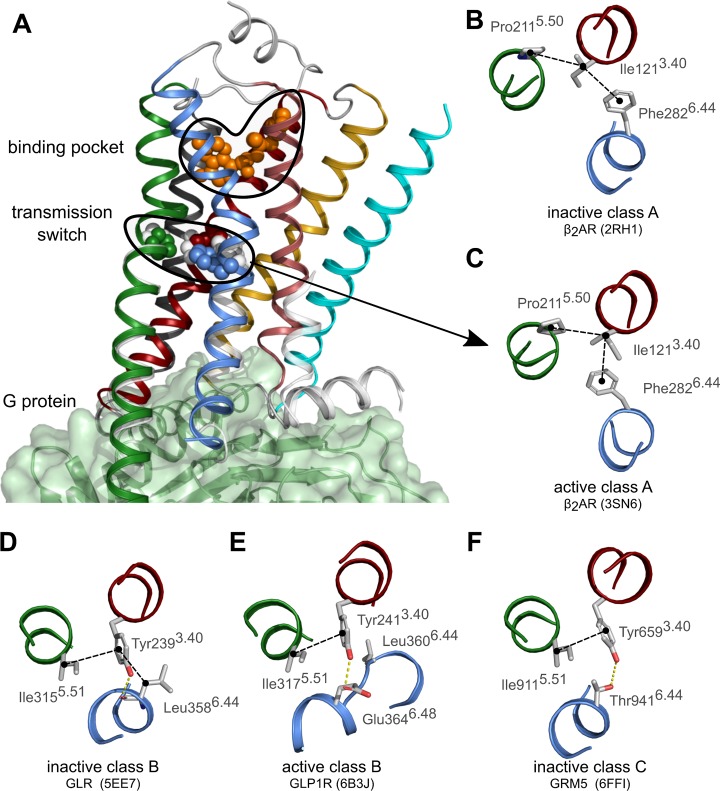
Fig 2. The transmission switch in the crystal structures of GPCRs.
(A) Cartoon representation of the crystal structure of the active β2-adrenergic receptor (PDB id 3SN6) in complex with the G protein (green surface) illustrating the localization of the transmission switch just below the orthosteric binding pocket. The sidechains of residues of the transmission switch (3.40, 5.50 and 6.44) and the ligand (in orange) are shown as spheres. The color-code for the TM helices is 1:cyan, 2:gold, 3:red; 4:dark-gray, 5:green, 6_blue, 7:pale-red. Helix 8 and loops are shown in light-gray. Superposed (in white) the cytoplasmic ends of TMs 5, 6 and 7 and the residues of the transmission switch in the inactive structure (PDB id 2RH1). (B-F) Detail of the “transmission switch” in the crystal structures of inactive (B) and active (C) β2-adrenergic receptor (ADRB2), inactive glucagon receptor (GLR) (D), active glucagon-like peptide 1 receptor (GLP1R) (E), and inactive metabotropic glutamate receptor (GRM5) (F). In receptors of classes B and C, residue 3.40 does not contact the residue at position 5.50 but rather the residue at position 5.51. (E-F) Dashed black lines indicate hydrophobic contacts whereas dashed yellow lines indicate hydrogen bonds.

