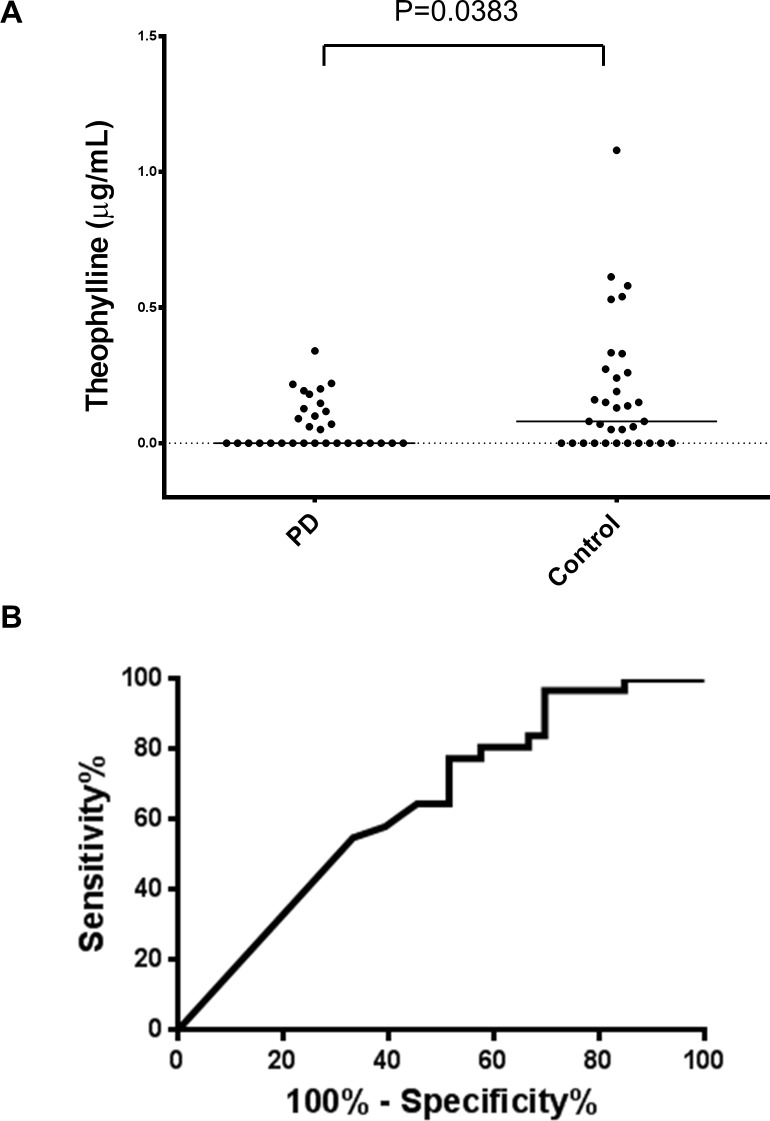
Fig 1. Theophylline levels in sera of the PD and control groups.
Fig 1(A) Scatter plot showing the levels of serum theophylline in the control (n = 33) and PD (n = 31) groups. Bars indicate median values. The levels of theophylline in the PD group were significantly lower than those in the control group (P = 0.0383). Fig 1(B) ROC curve showing serum levels of theophylline to discriminate PD patients from controls. The AUC value was 0.65.

