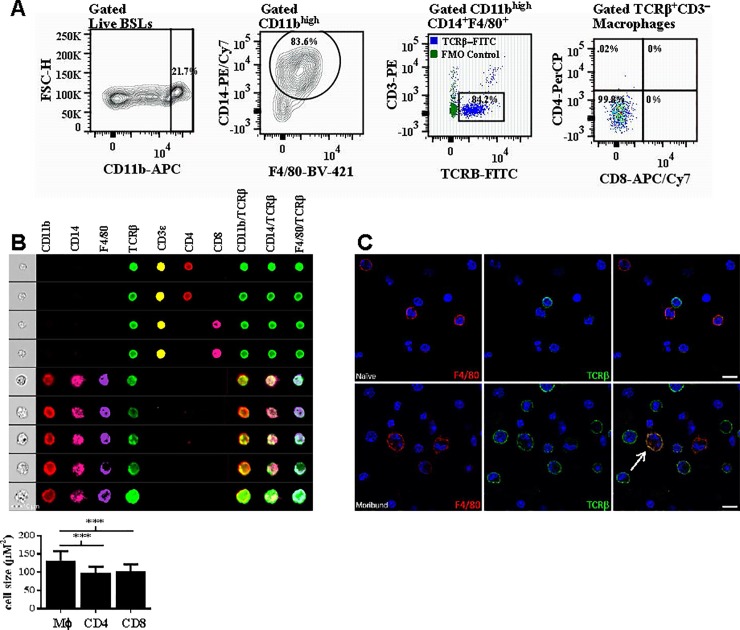
Fig 2. Brain sequestered macrophages express high levels of TCRβ.
A: Brain sequestered leukocytes (BSLs) purified from perfused brain tissue of moribund mice (n = 4) with experimental cerebral malaria on day 6 post-infection with Plasmodium berghei ANKA were stained for flow cytometric analysis. An FMO control (green) was used for gating purposes to determine the proportion of brain sequestered macrophages that express TCRβ (blue). B: CD11bhighCD14+F4/80+ macrophages that were TCRαβ+CD3ε− and CD4−CD8− were gated from live singlet BSLs purified from perfused brain tissue of moribund mice on day 6 post-infection and colocalization of TCRβ with the CD11b, CD14, and F4/80 monocyte/macrophage lineage markers was visualized on individual cells by AMNIS imaging. In addition, measurement of cell size by AMNIS imaging demonstrates that TCRβ expressing CD11bhighCD14+F4/80+ cells (n = 314) are significantly larger than CD4+TCRβ+CD3ε+ (n = 102) and CD8+TCRβ+CD3ε+ (n = 586) lymphocytes. C: Brain sequestered leukocytes (BSLs) purified from perfused brain tissue of naïve or moribund C57BL/6 mice on day 6 post-Pb−A infection were stained with the pan-macrophage marker F4/80 (red) and TCRβ (green) and counterstained with DAPI (blue). Cellular colocalization of TCRβ with F4/80 was observed by confocal microscopy on BSLs from moribund but not naïve mice. Importantly, isotype controls for F4/80 (rat IgG2a, κ) and TCRβ (Armenian hamster IgG) stained negative in both moribund and naïve mice. Significant differences between macrophage versus CD4+ and CD8+ T lymphocyte cell size are indicated as ****P < 0.001. P−values were calculated using the Student t test. Error bars indicate standard deviation.

