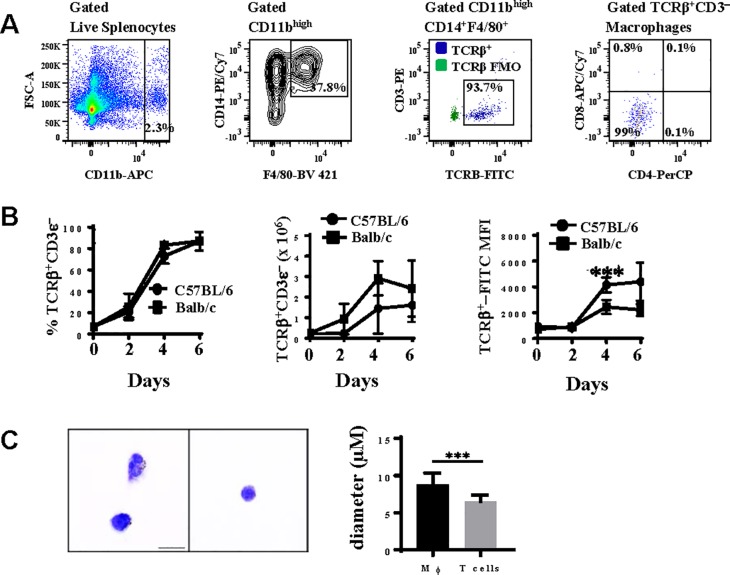
Fig 3. TCRβ expression on splenic macrophages during Plasmodium berghei ANKA malaria.
A: Splenic CD11bhighCD14+F4/80+ macrophages were quantitated by measuring the coexpression of CD14 and F4/80 on CD11bhigh cells gated from live lymphocytes isolated from spleen tissue. Using a TCRβ-FITC fluorescence minus one (FMO) control for gating purposes, the proportion of CD11bhighCD14+F4/80+ macrophages that were TCRβ+CD3ε− was then determined. TCRβ-expressing macrophages were also analysed for the expression of CD4 and CD8. B: The percentage, absolute number, and mean fluorescence intensity (MFI) of TCRβ on splenic CD11bhighCD14+F4/80+ macrophages was enumerated and compared in naïve and Pb−A infected C57BL/6 and Balb/c mice on days 2, 4, and 6 post-infection (n = 6 per time point for each strain of mouse). C: TCRβ+CD3ε−CD11bhighCD14+F4/80+ cells and TCRβ+CD3ε+ lymphocytes were sorted from spleen tissue on day 6 post-infection with Pb−A and stained with Giemsa to compare the size and morphology of each cell type. Cell size was compared by measuring the diameter (μm) of TCRβ+CD3ε−CD11bhighCD14+F4/80+ cells (n = 60) versus TCRβ+CD3ε+ lymphocytes (n = 60). Data shown is representative of three independent experiments. Significant differences between C57BL/6 and Balb/c mice are indicated as ***P < 0.001. P−values were calculated using two-way ANOVA followed by Bonferroni. Error bars indicate standard deviation. Significant difference in cell size (diameter) between TCRβ+CD3ε−CD11bhighCD14+F4/80+ cells and TCRβ+CD3ε+ lymphocytes is indicated as ***P < 0.001. P−value was calculated using Student’s t test. Error bars indicate standard deviation.

