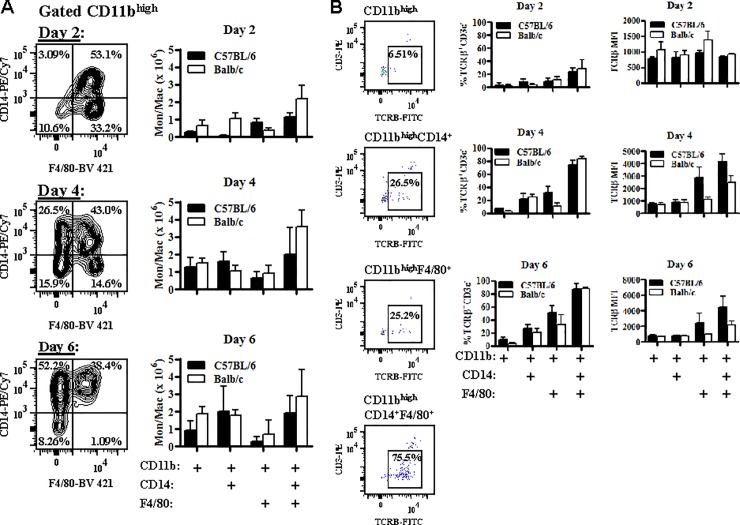
Fig 4. Optimal expression of TCRβ is associated with coexpression of both CD14 and F4/80 on CD11bhigh cells.
A: C57BL/6 (n = 6) and Balb/c (n = 6) mice were infected with 106 Plasmodium berghei ANKA parasites. CD14 and F4/80 expression was then measured on gated CD11bhigh splenocytes on days 2, 4, and 6 post-infection and in naïve mice (data not shown) and the absolute number of CD11bhigh, CD11bhighCD14+, CD11bhighF4/80+, and CD11bhighCD14+F4/80+ cells was enumerated at each time point. B: The effect of CD14 and F4/80 on TCRβ expression on CD11bhigh splenocytes was also determined in C57BL/6 and Balb/c mice by comparing the expression of TCRβ on CD11bhigh, CD11bhighCD14+, CD11bhighF4/80+, and CD11bhighCD14+F4/80+ cells. The percentage of cellular subsets that were TCRβ+CD3ε− and the TCRβ-FITC mean fluorescence intensity (MFI) were calculated on days 2, 4, and 6 post-Pb−A infection. Data presented is representative of three independent experiments. The absolute number of cellular subsets that were TCRβ+CD3ε− can be found in S3 Fig.

