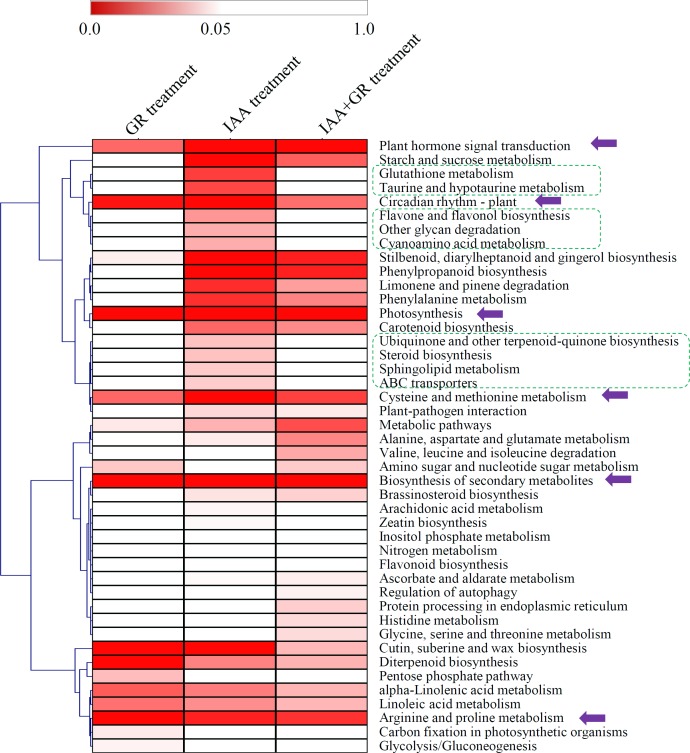
Fig 4. KEGG enrichment analysis of the DEGs in the three comparisons.
The significant P values of each KEGG term under different hormone treatments were shown by a heatmap. Purple arrows indicated the metabolic pathways significantly changed under all the three treatments. Green boxes indicated the metabolic pathways only significantly changed under the IAA treatment.

