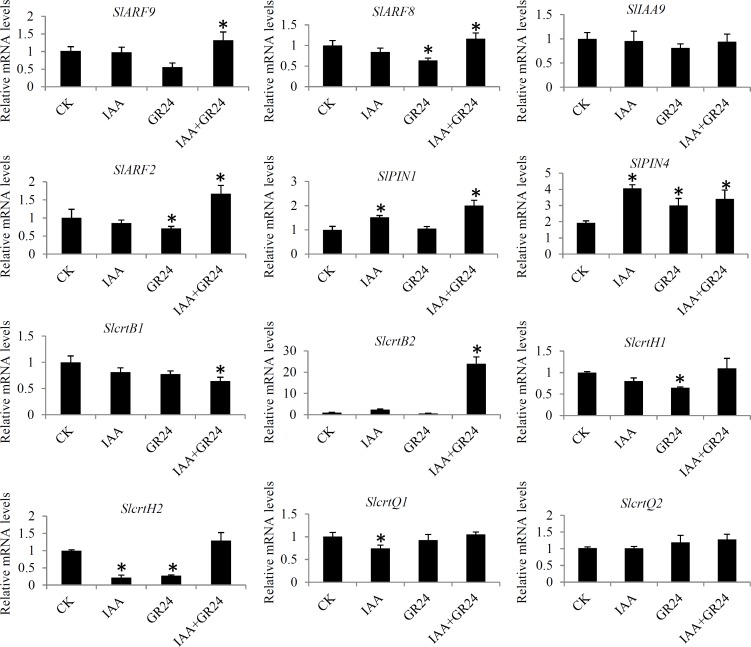
Fig 6. Real-time quantitative PCR validation of several hormone-related genes.
The histogram shows the relative expression level of these genes with respect to the ACTIN in tomato. The data were analyzed by three independent repeats, and standard deviations were shown with error bars. Significant differences in expression level were indicated by “*”.

