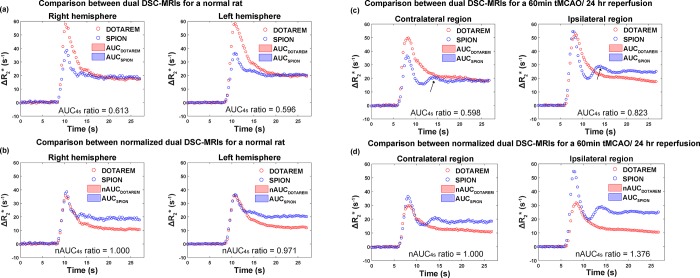
Fig 1. The process of nAUC ratio value estimation.
(a) ΔR2* curve and AUC of SPION and Dotarem for unnormalized DSC-MRI signal of normal rat. Corresponding AUC ratio values were 0.613 and 0.596 for right and left hemispheres, respectively. (b) ΔR2* curve and AUC of SPION and Dotarem for normalized DSC-MRI signals of normal rat. Corresponding nAUC ratio values were 1 and 0.971 for right and left hemispheres, respectively. (c) ΔR2* curve and AUC of SPION and Dotarem for unnormalized DSC-MRI signal of tMCAO rat. Corresponding AUC ratio values were 0.598 and 0.823 for contralateral and ipsilateral hemisphere, respectively. (d) ΔR2* curve and AUC of SPION and Dotarem for normalized DSC-MRI signal of tMCAO rat. Corresponding nAUC ratio values were 1 and 1.376 for right and left hemispheres, respectively. Black arrows in (c) represent the second peak from recirculation from SPION DSC-MRI times curves.

