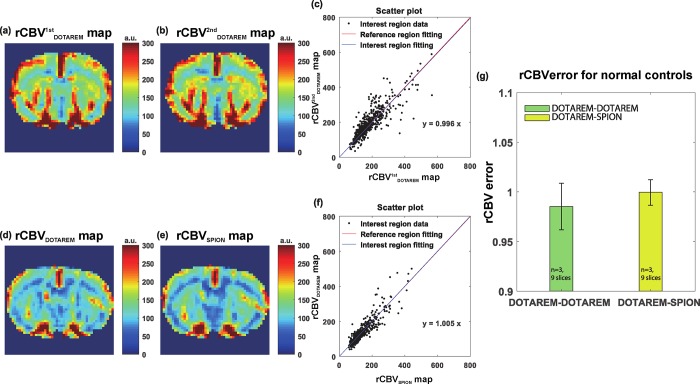
Fig 2. Results of in vivo experiment with normal rats (control experiments).
(a) and (b) show the normalized AUC from the first injection (nAUCDotarem) and the AUC from the second injection (AUCDotarem), respectively. (c) Scatter plot of nAUCDotarem and AUCDotarem in the left hemisphere (black dots). The red and blue lines are fitted lines to the right- and left-hemisphere scatter plots, respectively. (d) and (e) show the normalized AUC from the first Dotarem injection (nAUCDotarem) and the AUC from the second SPION injection (AUCSPION), respectively. (f) Scatter plot of nAUCDotarem and AUCSPION in the left hemisphere (black dots). The red and blue lines are the corresponding fitted lines to the right- and left-hemisphere scatter plots. (g) Statistical analysis of nAUC ratio. The statistical unit nsl is the number of slices. The green and yellow bar graphs show the nAUC ratio values in the Dotarem-Dotarem and Dotarem-SPION cases, respectively, in normal rats (green bar: 0.990 ± 0.023 [mean ± standard deviation, n = 3, with 9 slices], yellow bar: 1.002 ± 0.017 [n = 3 with 9 slices], p > 0.05 [p = 0.136]). a.u. means arbitrary unit.

