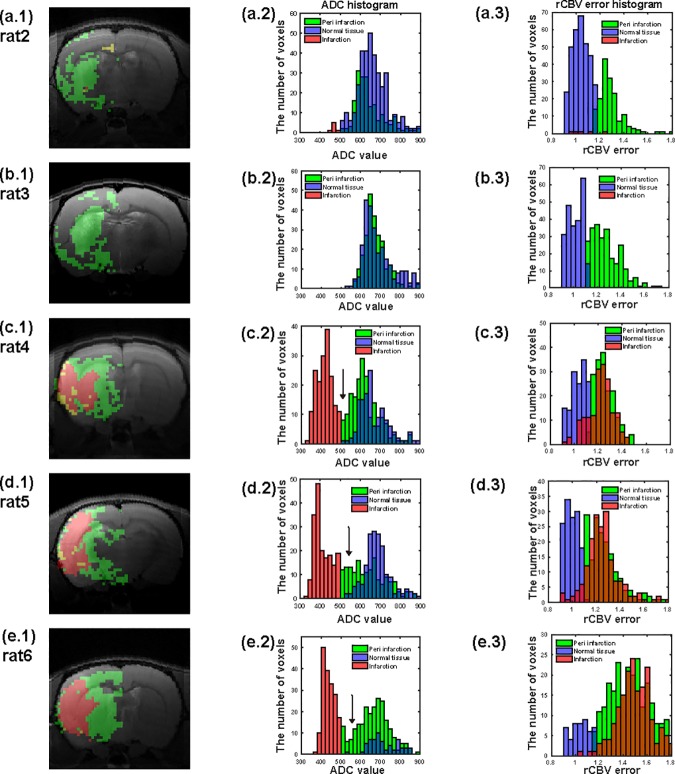
Fig 4.
(a.1), (b.1), (c.1), (d.1), (e.1) show infarcted areas with BBB damage (ADC < 500 μm2/s and rCBVerror > threshold) in red and peri-infracted areas with BBB damage (ADC > 500 μm2/s and rCBVerror > threshold) in green. Infarcted area without BBB damage (ADC < 500 μm2/s and rCBVerror < threshold) is shown in yellow, but scarce. (a.2), (b.2), (c.2), (d.2), (e.2) show histograms of ADC values of corresponding infarcted (red), per-infarcted with BBB-damage (green), and normal (purple) areas. The normal region satisfies the condition of ADC > 500 μm2/s and rCBVerror < threshold. The overlapping ADC values between peri-infarcted (green) and normal (purple) areas are shown in dark blue. (a.3), (b.3), (c.3), (d.3), (e.3) show histograms of rCBVerror values corresponding to infarcted (red), per-infarcted with BBB damage (green), and normal (purple) areas. The overlapping rCBVerror values between infarcted (red) and peri-infarcted (green) areas are shown in dark orange.

