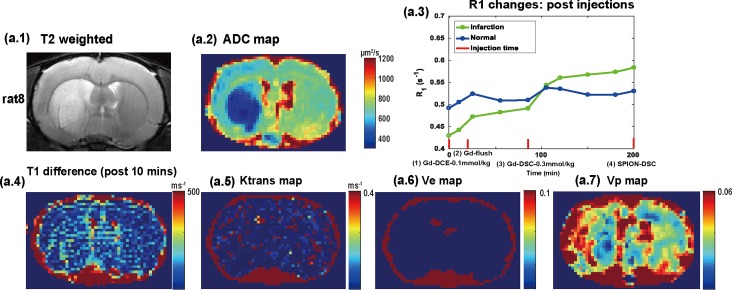
Fig 5.
(a.1) T2-weighted image. (a.2) ADC map. (a.3) T1 changes were shown for infarction (green) and normal (blue) region as a function of post-injection time, where injection time-points were marked with red lines. No significant T1 difference between infarction and normal region were observed from (a.4) T1 difference map (post-10 mins) after the injection of DOTAREM (0.1 mmol·kg-1). (a.5) Ktrans map. (a.6) Ve map. (a.7) Vp map.

