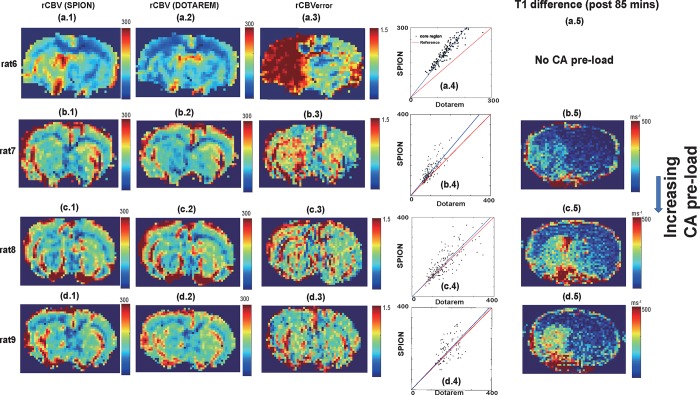
Fig 6.
(a.1-d.1) rCBV maps from SPION. (a.2-d.2) rCBV maps from DOTAREM (a.3-d.3) rCBVerror map. (a.4-d.4) Scatter plots of rCBVSPION/rCBVDOTAREM values in core region normalized to each normal area. (a.5-d.5) T1 difference maps (post 85 mins) with increasing CA pre-load. No T1 difference map was available for no CA pre-load case and not available.

