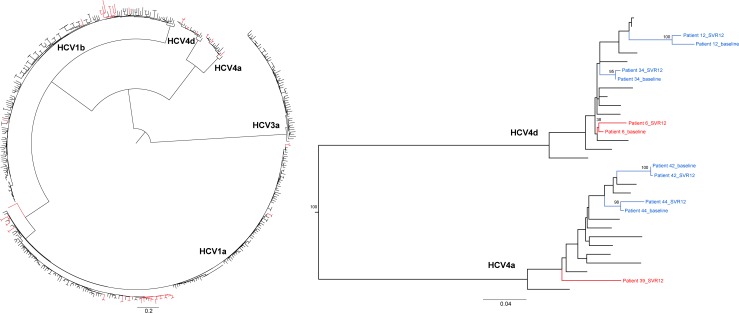
Fig 2. Maximum-likelihood tree of the concatenated alignment covering genetic regions NS3 and NS5A.
Both the entire phylogenetic tree and the HCV4 (4a and 4d) clade in detail are visualized. Clusters of patients coloured in blue, are suggested to have experienced a virological relapse, supported by bootstrap values >70%. However, for patient 6, indicated in red, only a bootstrap value of 38 was obtained, resulting in lack of evidence to distinguish between a relapse and reinfection. For patient 39, the fragment NS3-NS5A was only sequenced for the sample at time of SVR12 evaluation. The bar at the bottom represents the number of nucleotide substitutions per site.

