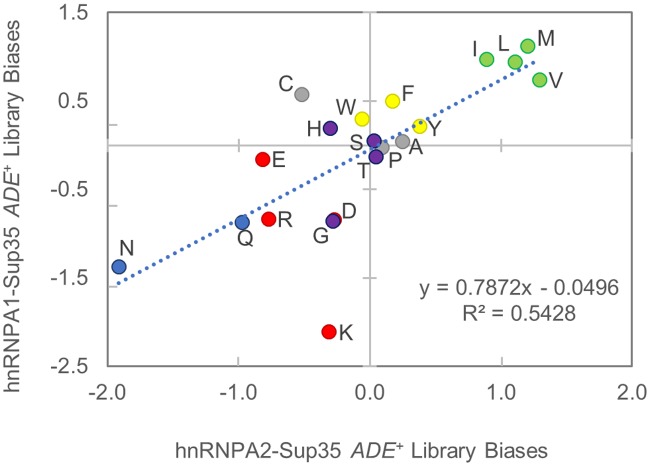
Fig 3. Similar amino acid biases govern the ADE+ phenotype within the A1 and A2 PrLD’s.
Comparison of the log-odds ratio for each amino acid between the A1 and A2 libraries. The log-odds ratios reflects the degree of over-/under-representation of each amino acid among constitutive ADE+ isolates, relative to ade- isolates. Colors correspond to the amino acid groups in Table 1.

